Real Science | 2 March 2016
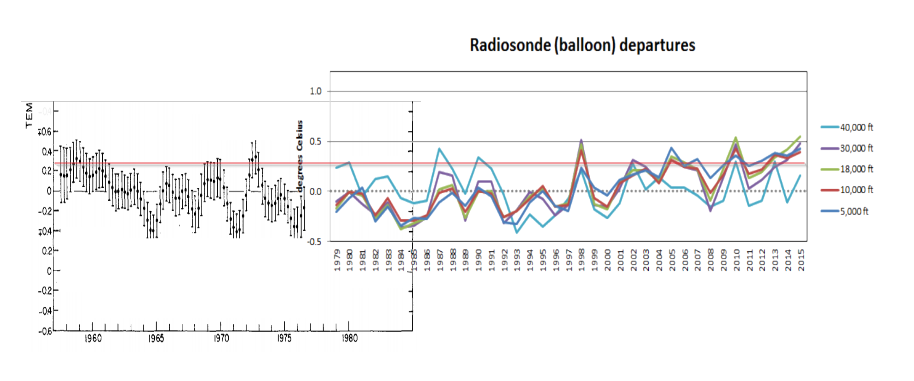
In their “hottest year ever” press briefing, NOAA included this graph, which stated that they have a 58 year long radiosonde temperature record. But they only showed the last 37 years in the graph.
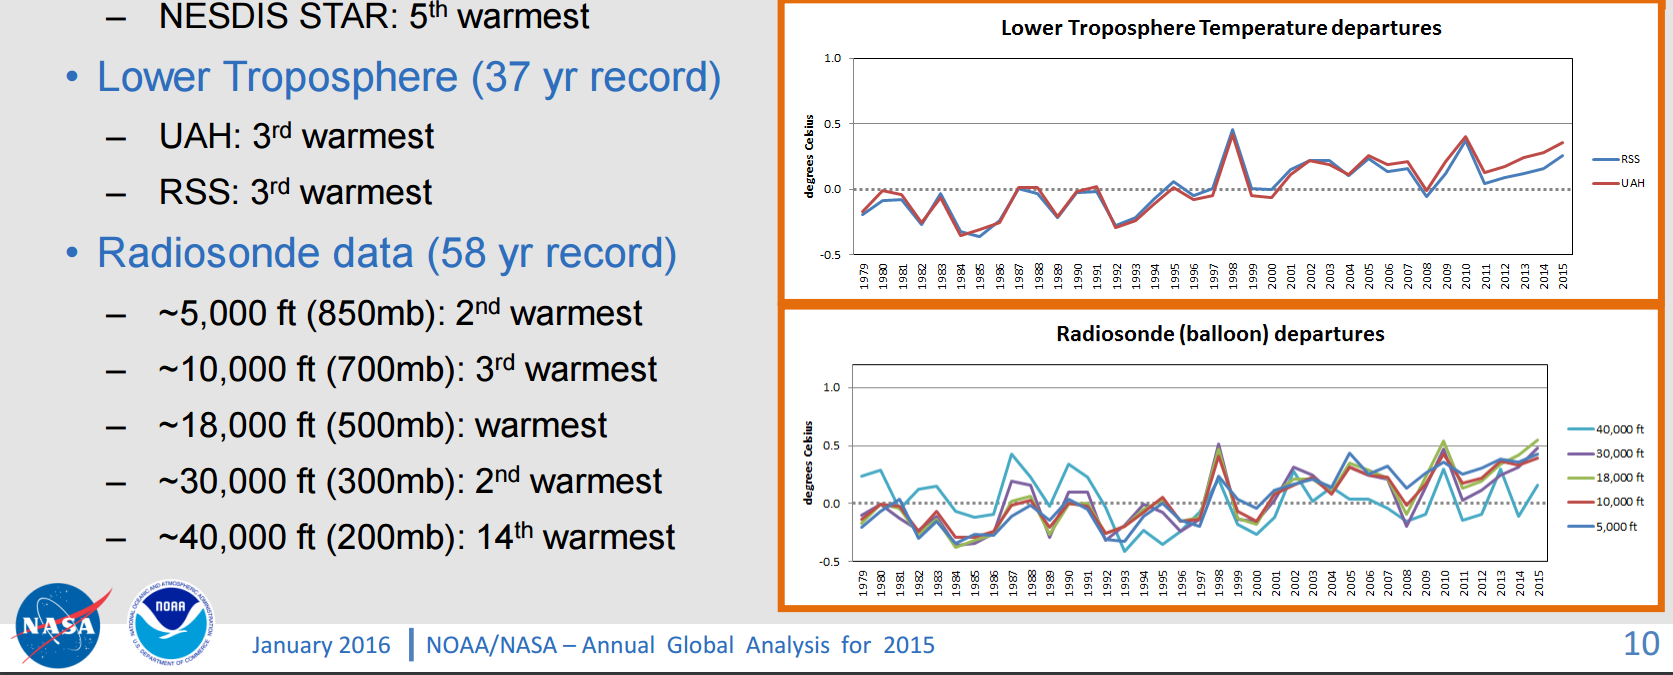
NESDIS Strategic Communications
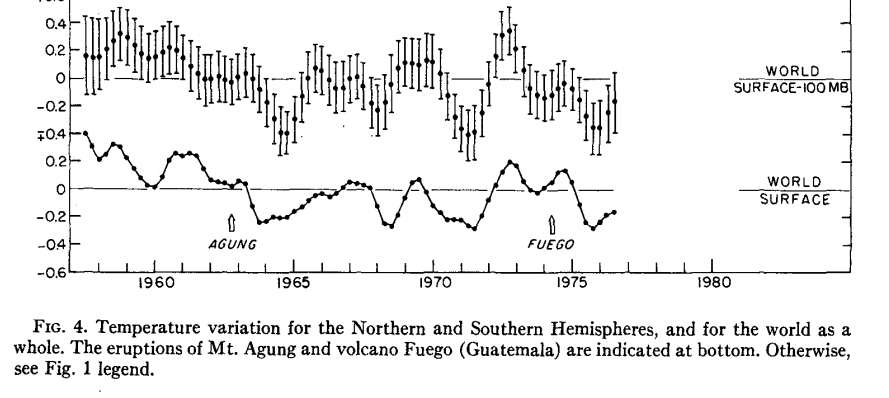
Here is why they are hiding the rest of the data. The earlier data showed as much pre-1979 cooling as the post-1979 warming.
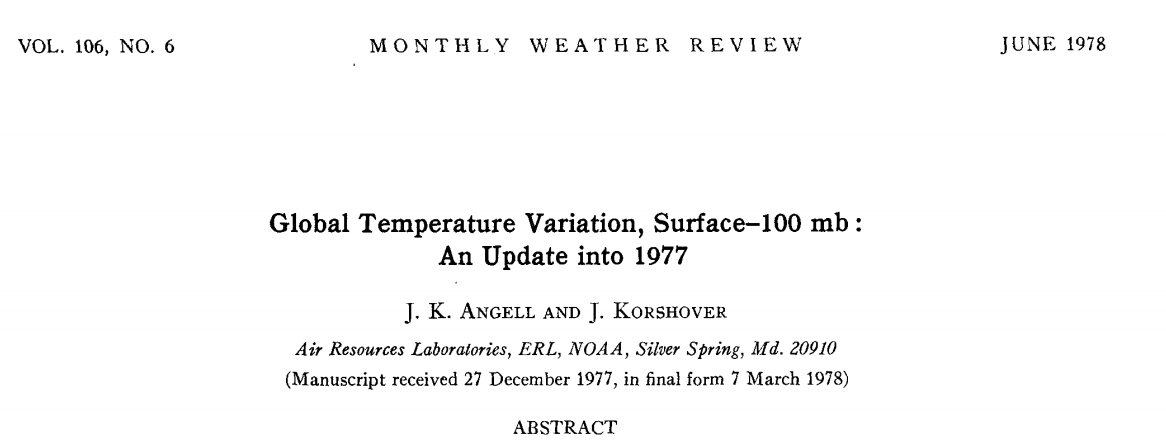
1520-0493(1978)106<0755:GTVSMA>2.0.CO;2
I combined the two graphs at the same scale below, and put a horizontal red reference line in, which shows that the earth’s atmosphere has not warmed at all since the late 1950’s
The omission of this data from the NOAA report, is just their latest attempt to defraud the public. NOAA’s best data shows no warming for 60 years. But it gets worse. The graph in the NOAA report shows about 0.5C warming from 1979 to 2010, but their original published data shows no warming during that period.
 cdiac.esd.ornl.gov/ftp/trends/temp/angell/global.dat
Due to Urban Heat Island Effects, the NOAA surface data shows nearly one degree warming from 1979 to 2010, but their original radiosonde data showed no warming during that time. Global warming theory is based on troposphere warming, which is why the radiosonde data should be used by modelers – instead of the UHI contaminated surface data.

NOAA’s original published radiosonde data showed no net troposphere warming from 1958 to 2010, when the data set ended.

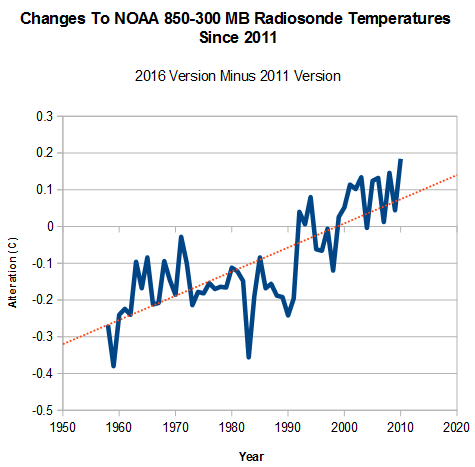
The next graph shows how NOAA has altered their 850-300 mb temperature data since 2011. Another hockey stick of data tampering.