Trust the Evidence | 19 Sep 2023
Restrictions, lockdowns and travel measures changed over 200 times in 2020. No one could keep up with the changes. By the time one step had come in, it was onto the next. For example, the rules on going out – to a pub or a restaurant – were changed 20 times up to September 2020. Many didn’t know the rules and didn’t care. Some statements like “closing the borders with Wales” appeared to be taken from an episode of BBC’s smash surreal hit Fawlty Towers.
In the Covid Inquiry, the former Health Secretary Matt Hancock’s position was clear: we need to lock down harder and faster next time: “but it is not nearly as important as getting the doctrine right so in future, we’re ready to suppress a pandemic, unless the costs of lockdown are greater than the costs that the pandemic would bring.”
This is quite a scary thought, but throughout this book, we’ve tried to explain the issues, and this time, we’ll ask whether lockdowns worked to reduce hospitalisations and, significantly, deaths.
In March 2020, within ten days, the UK went from an advisory position to stop non-essential contact and travel to a mandatory lockdown to stay home.
The first question to address is how did the restrictions change behaviour.
Using Worldometer data, by March 23, workplace mobility was down by 28%, retail by 33 and transport by 40% – all were still on a downward trajectory.
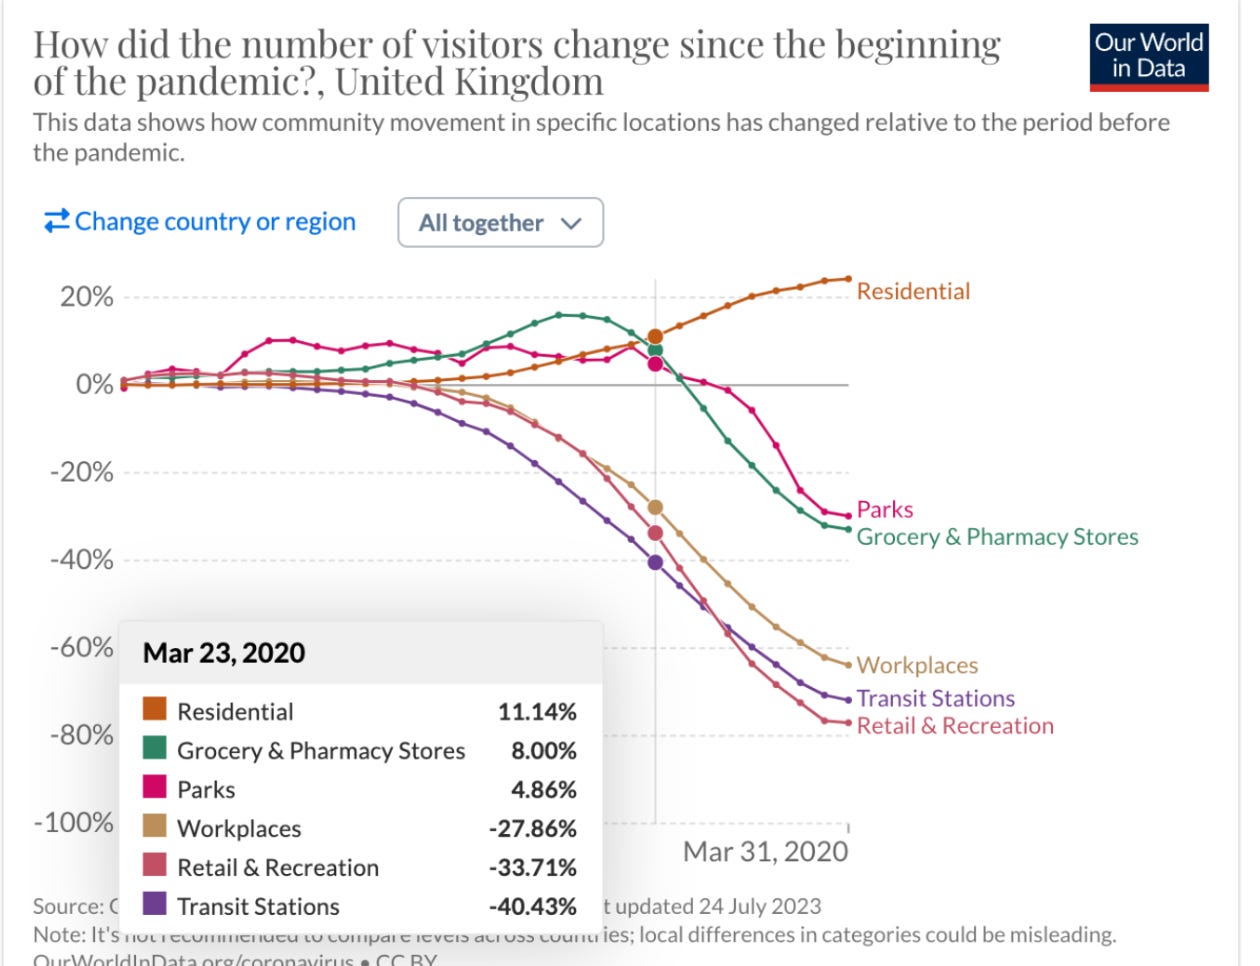
The increase in grocery sales was kicked off by panic buying – people flocked to supermarkets: it was rice and instant noodles in Singapore; in New Zealand, spending shot up 40 per cent despite no cases, and globally, hand sanitiser sales were up 800 per cent.
On March 20, Matt Hancock commented that people should buy only “what they need and not more than what they need” following a highly shared video on social media from critical care nurse Dawn Bilbrough. She was in tears after coming off a 48-hour shift in intensive care and found that we were “just stripping the shelves bare of essential foods. However, the message only increased the panic – By late March, toilet paper became the coveted item – visits to the grocery store – pre-lockdown – were up by nearly 20%
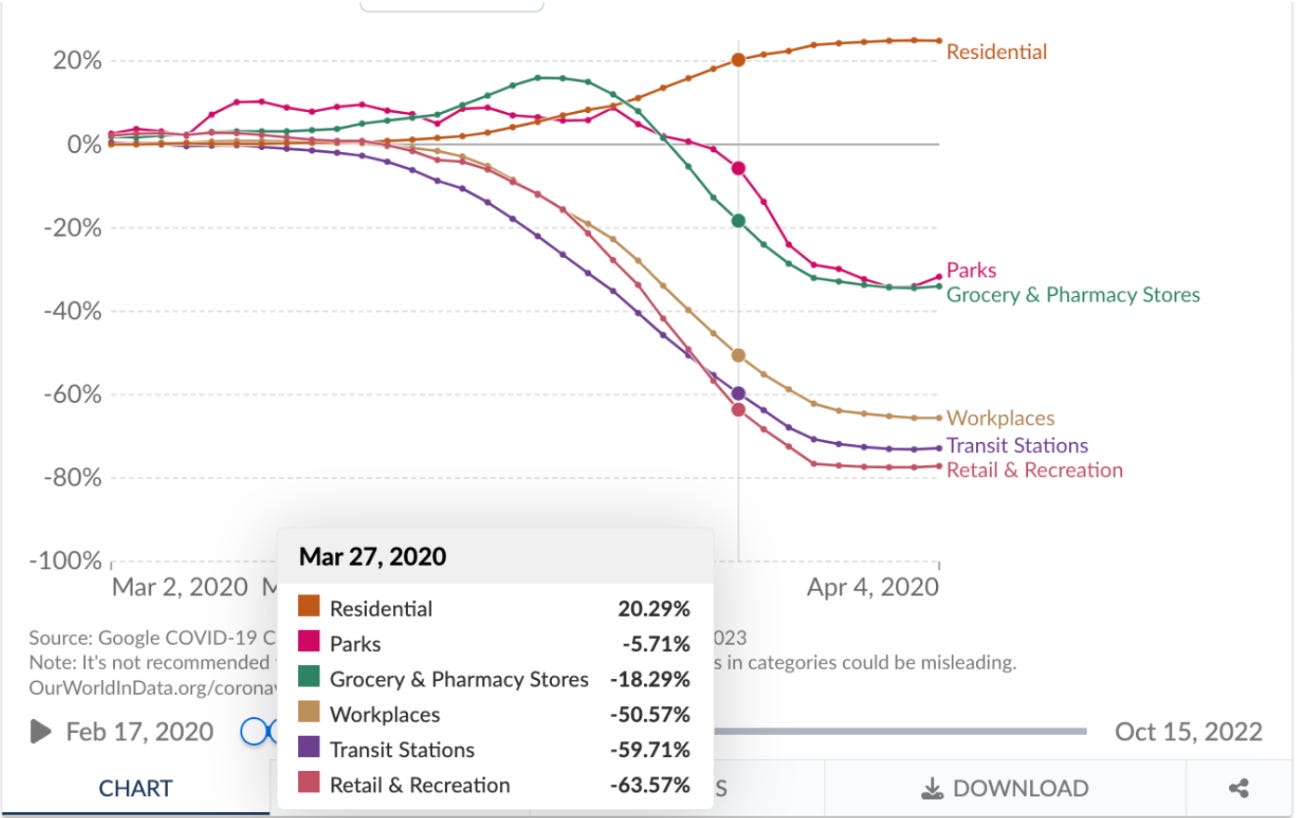
So, what did the lockdown do on March 27? It drove down the visits to supermarkets, shops, and parks the most and gave rise to further falls in those attending the workplace and transport in line with what was already a downward trend.
Upgrade to paid
You could simplify this behaviour and call it a rule of thirds: the advice got you roughly a third reduction in workplace visits, transport, and retail use. The anticipation of lockdowns gets you further reductions – a little less than a third reduction in and roughly a third reduction in visits to parks and grocery stores. However, the residential figure doesn’t quite add up: if two-thirds are not at work, not on transport, and not shopping, then why did our residential activities only increase by 20%?
So lockdowns managed to change our habits most in terms of going to the park and going shopping, In terms of workplace behaviours, and using transport substantial effects had already occurred with advice, but because there was still essential work to be done, a third of folks were still at work.
However, we are interested in the impact of lockdowns on infections and whether the timings changed hospital admissions and deaths.
Infections
The Royal College of General Practitioners surveillance data reports trends for Influenza-Like Illness (ILI), upper respiratory tract infections (URTIs) and lower respiratory tract infections (LRTI), along with weekly data on COVID-19 case investigations. The data come from over 4 million patients in a network of general practices across England and Wales.
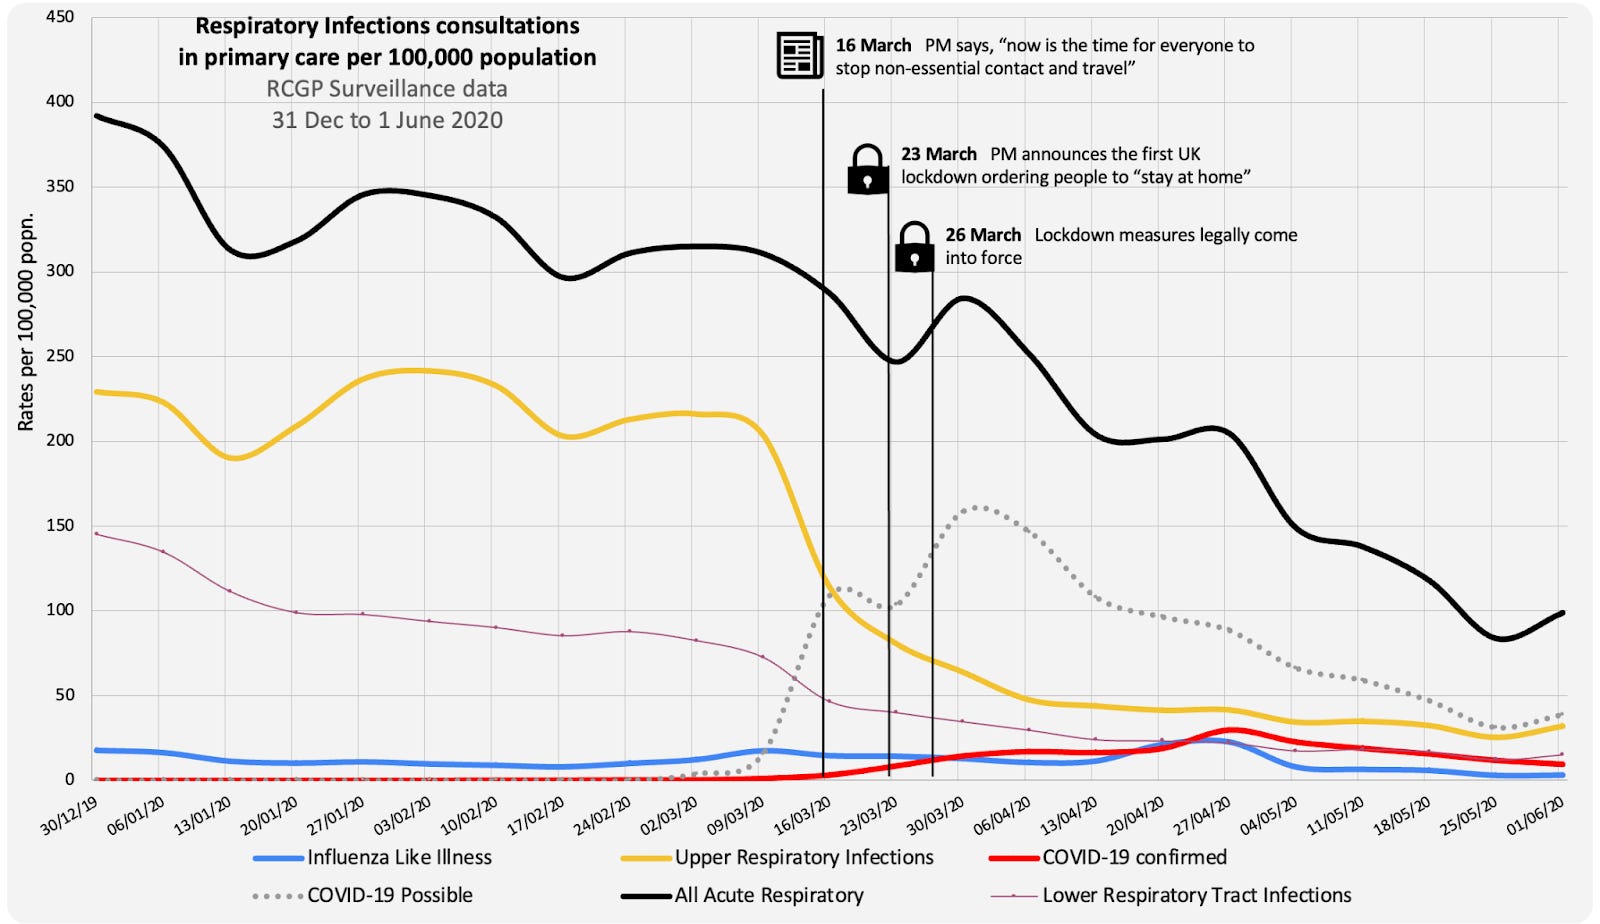
Primary care’s overall acute respiratory infection rate fell on March 9 2020. By the time of the lockdown, there was little impact on this rate; however, the stay-at-home orders, the message to protect the NHS, and the virtual shutdown of General practice may have affected the infection rates. We cannot turn to the ONS Infection survey in the period as it wasn’t yet up and running.
But, we can look at the case data reported on the coronavirus dashboard, which reports the date the sample was taken from the tested person.
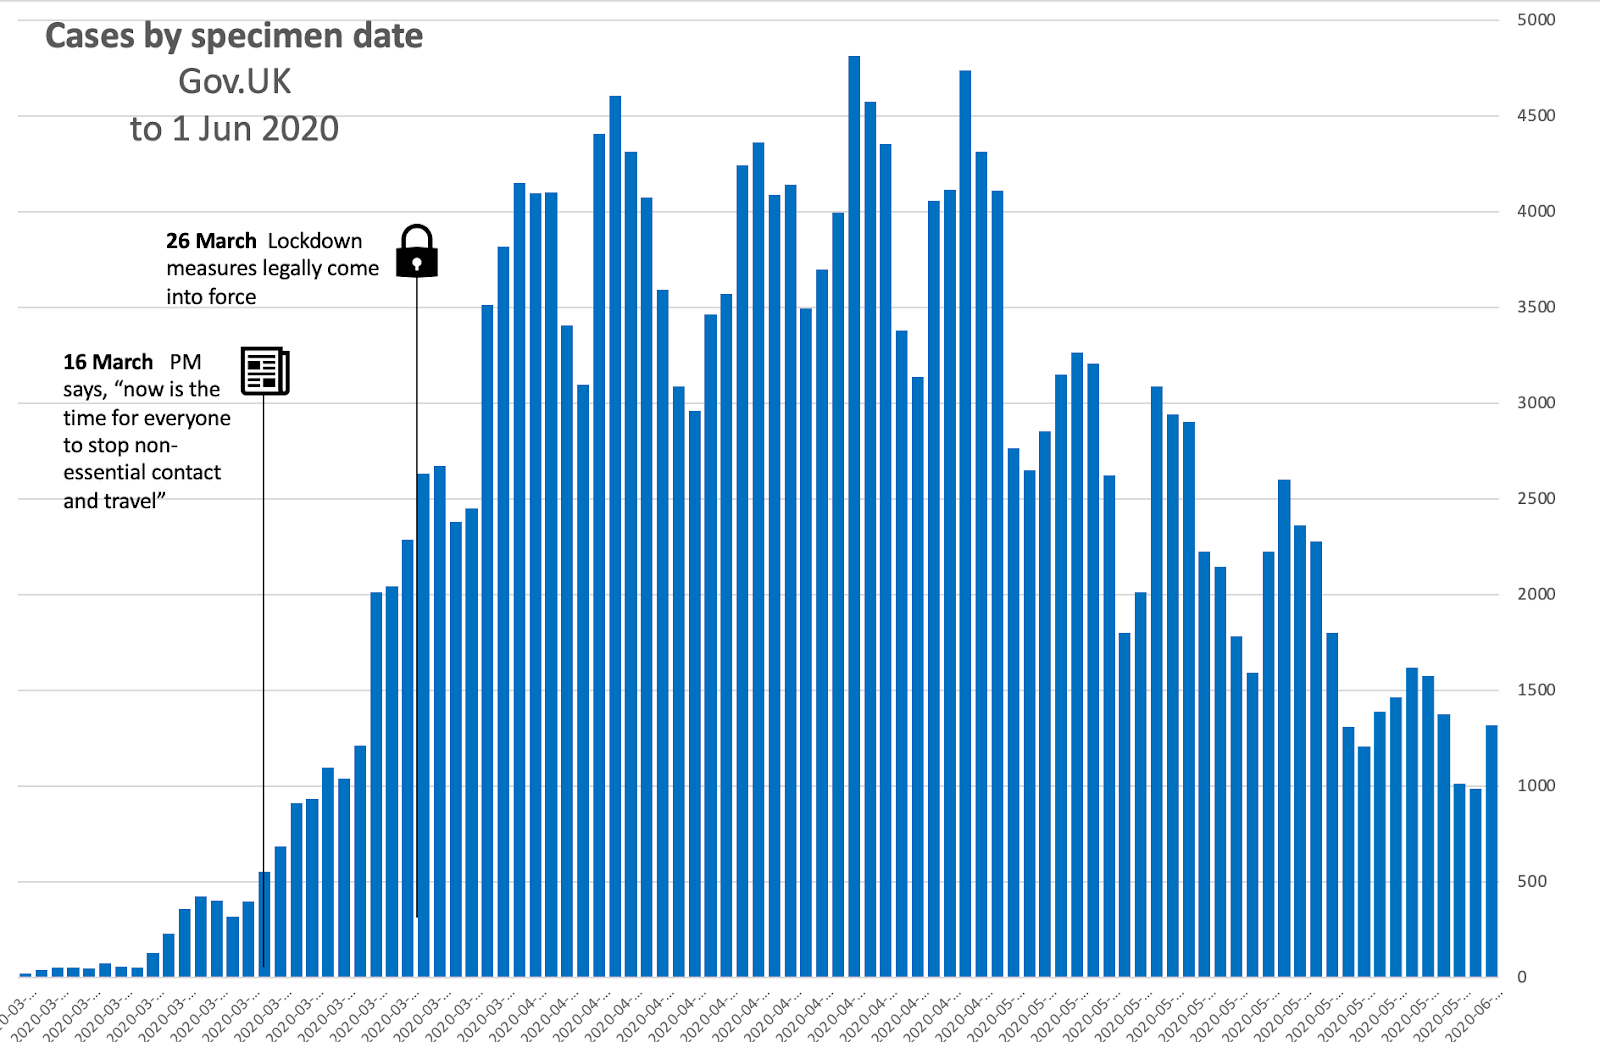
This data shows infections didn’t fall until April 30 – five weeks after the lockdowns. Not what you’d expect if lockdowns were a swift, effective intervention, as they were purported to be, they were undoubtedly no hammer.
Several reasons might explain this. First, our systematic review of close contact showed the frequency of secondary attacks was highest in home/quarantine settings. The policy that meant individuals could leave the house for 1 hour to exercise each day was a mistake: forcing everyone to stay home transiently increases infections and significantly impacts health and well-being—over one in four people in England exercised less than usual in the first lockdown. Those who were BAME, obese or city dwellers reported more significant reductions. There was also a marked decline in older adults – just the group you can’t afford to have reductions in exercise for, as it puts them at risk of deconditioning and developing more severe health problems and death. Unless you lived in a house with a big garden or near a nature reserve, the policy was a disaster regarding healthy lifestyles – we ate more, drank more and stayed on the couch. Netflix subscribers surged – almost 16 million people created new accounts in the first quarter of 2020.
Second, we had an incomplete picture as testing was mainly focused in hospitals; there was no community testing and no ONS Survey data based on random infection. Third, the problem of hospital-acquired infections where the bulk of testing occurred may have led to a sustained increase in cases. However, we have an incomplete summary of the infections in the first wave since only data about lab-confirmed cases of COVID-19 were available, and they were far lower than the actual number of infections.
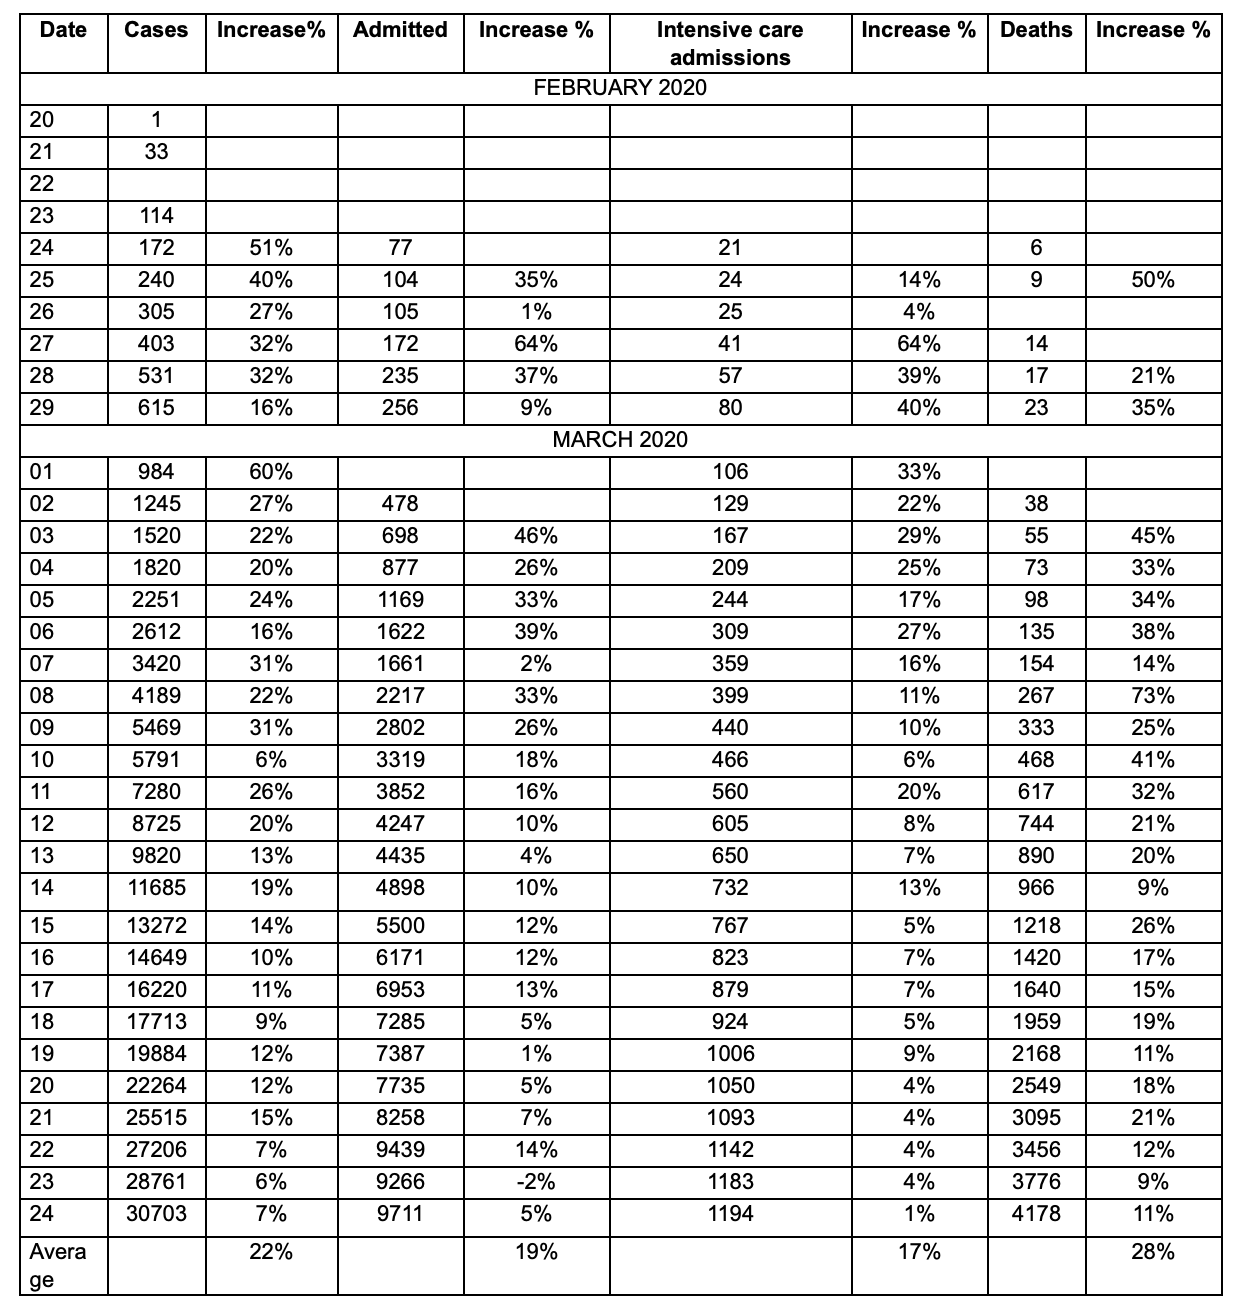
Before we go further into the data, we return to the Imperial College Report 9, which had such an impact on the need to lockdown. In the report, the proportion of infected requiring hospitalisation was obtained from an analysis of a subset of cases from China. It’s more guesswork, but let’s run with it for now. These estimates result in 4.4% of infections being hospitalised. The figures suggest unmanageable demand levels – 44,000 admissions for every million infected, leading to a peak in ICU demand that would have been 30 times greater than the maximum supply.

Admissions peaked in the week ending April 10 with 17,763 admissions. If we back-calculate using the 4.4% hospitalisation rate, we estimate over 400,000 infections weekly. However, from the week before to April 3, only 24,507 cases were recorded on the dashboard. From this number of cases, we would expect just over 1,000 admissions. So either the number of infections in the community was vastly underestimated, or the number of hospital-acquired infections was very large – it’s likely a combination of both.
The Telegraph got hold of minutes from SPI-M (Scientific Pandemic Influenza Group on Modelling) released under a Freedom of Information request; they show that by March 16, modellers were still “uncertain” of case numbers “due to data limitations”.
“The minutes show that members were waiting for comprehensive mortality data from Public Health England (PHE) and said that current best estimates for the infection fatality rate, hospitalisation rates, and the number of people needing intensive care were still uncertain.
They also believed that modelling only showed “proof of concept” that lockdowns could help, and warned that “further work would be required”.
The team was also encouraged to look for collaborators and resources outside of the infectious diseases network.” They didn’t.
Tom was quoted branding the early pandemic modelling “irresponsible”.
“They should have said ‘I’m sorry, we do not have the data,” he said. “Any forecast based on limited data is just a guess, it’s unethical and reckless, and we can now see the consequences of this behaviour with people dying because of the destruction of our services.”
What is clear, though, is hospital care for non-COVID diseases dropped off a cliff: across the UK, admission fell for cancer (by 40%), cardiovascular disease (22%) and respiratory disease (19%). People were scared; they didn’t turn up, as the message to protect the NHS worked too well.
Across the pandemic, the mean was estimated as nine days from infection to hospitalisation and 21 days from infection to death. So, if you lockdown on March 26 and allow for a week’s worth of transient increase infections due to the household effect, you’d assume that deaths would peak four weeks after the lockdown started – April 25.
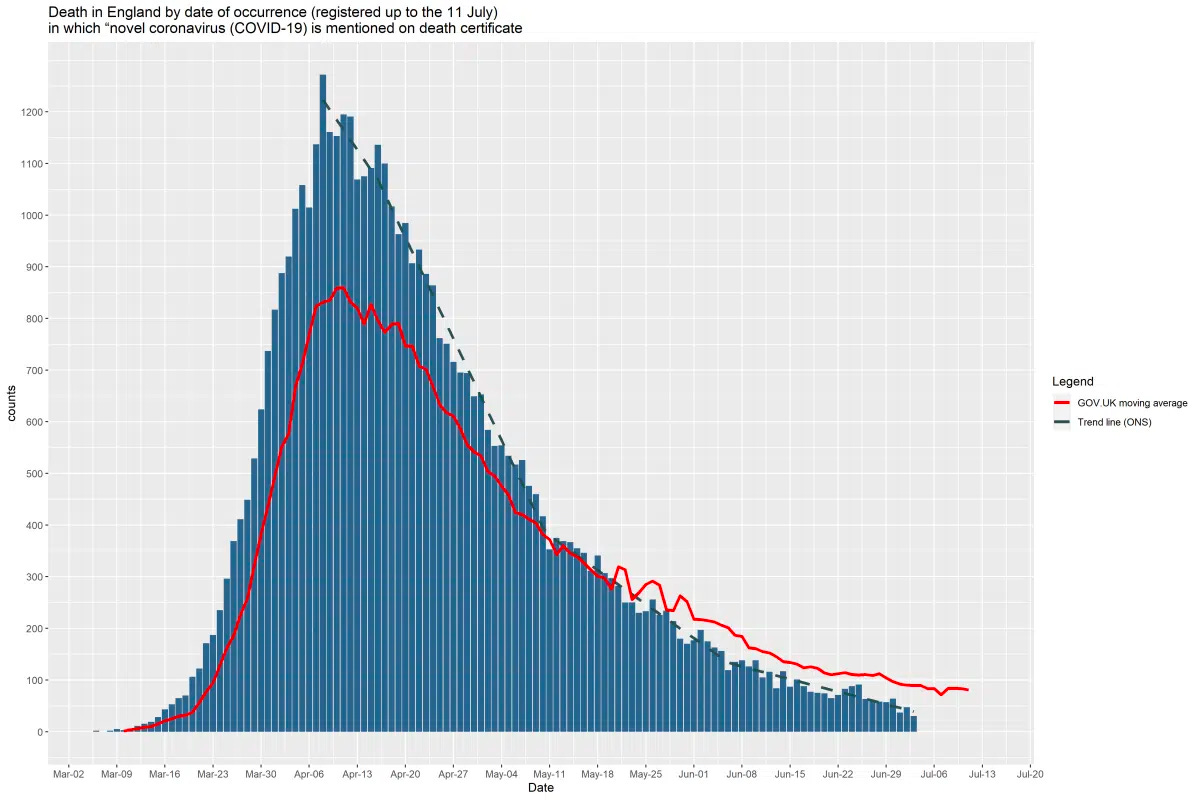
However, our analysis showed that deaths, where covid was mentioned on the certificate, peaked on April 8 with 1,272 deaths and fell sharply after that. If we use deaths as the objective peak, we estimate that the peak of infections was at the beginning of March, which is in line with the drop off in acute respiratory infections reported by the RCGP surveillance.
A second national lockdown began in England on November 5 2020, and ended on November 26 2020, where it was replaced by local restrictions (“tiers”).
The advisors had again misread the data. Positive tests were rising sharply in London and the South East before the end of lockdown; they had already peaked up North. The strategy in 2020 had managed to push the infection into mid-winter, just when you didn’t want a swathe of immune naive people. The third lockdown was just around the corner, along with the scaremongering concept of variants of concern. Lockdowns didn’t curtail the virus in 12 weeks, as Johnson said; suppression failed, they didn’t prevent future lockdowns, they had no effect on hospital-acquired infections, and when they used the data doesnt back up that they impacted deaths. Vitally, they failed to protect care homes.
The timing of lockdowns is also a big issue. Timing depends on sound knowledge of what is happening, something we doubt ever occurred during the past pandemic.
The table is part of a document the Lombardy Italian governments used to make decisions. We suggest you disregard deaths with unclear attribution rules and ICU admissions that were confounded by the “just in case” approach in a proportion of early cases.
The epidemic peaked around the end of the first week in March, but a national lockdown was introduced on March 9. The situation in Lombardy and neighbouring Bergamo was the main reason for introducing national lockdowns, so unless we have an actual look at the data, we will draw the false inference that the lockdown in Italy worked.
Lockdowns act to normalise the risk across age groups, ensuring those most at risk of adverse events have the same risk as those with the least risk. For some, lockdowns provide a simple tool for a highly complex problem. But they meant that strategies were not deployed or trialled to protect the most vulnerable. Lockdowns are alluring because they offer a simple message: staying home will protect you. But does it?


