GWPF | 9 Feb 2015
Temperature Adjustments Transform Arctic Climate History
When future generations look back on the global-warming scare of the past 30 years, nothing will shock them more than the extent to which the official temperature records – on which the entire panic ultimately rested – were systematically “adjusted” to show the Earth as having warmed much more than the actual data justified. –Christopher Booker, The Sunday Telegraph, 8 February 2015
Of much more serious significance, however, is the way this wholesale manipulation of the official temperature record – for reasons GHCN and Giss have never plausibly explained – has become the real elephant in the room of the greatest and most costly scare the world has known. This really does begin to look like one of the greatest scientific scandals of all time. –Christopher Booker, The Sunday Telegraph, 8 February 2015
1) The Fiddling With Temperature Data Is The Biggest Science Scandal – The Sunday Telegraph, 8 February 2015
2) Temperature Adjustments Transform Arctic Climate History – Not A Lot Of People Know That, 4 February 2015
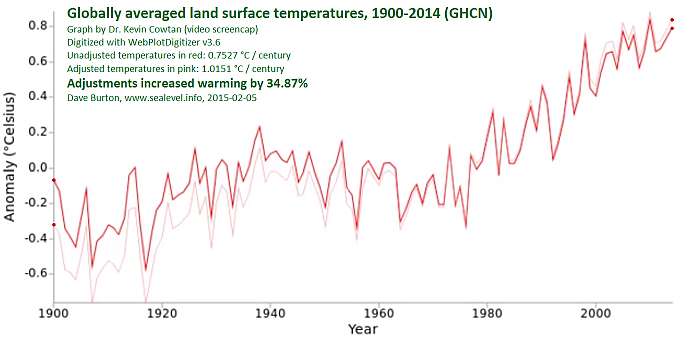
3) Globally Averaged Land Surface Temperatures, 1900-2014 (GHCN) – Sea Level Info, 9 February 2015
How much warmer is the Arctic now than it was 80 years ago? Quite a lot, according to GISS. But can we trust their figures? I can now confirm that similar “cooling the past” adjustments have been carried out in the Arctic region, and that the scale and geographic range of these is breathtaking. Nearly every current station from Greenland, in the west, to the heart of Siberia (87E), in the east, has been altered in this way. The effect has been to remove a large part of the 1940’s spike, and as consequence removed much of the drop in temperatures during the subsequent cold decades. –Paul Homewood, Not A Lot Of People Know That, 4 February 2015
Has the Arctic warmed up since the 19thC, which is said to have been the coldest time since the Ice Age? Definitely. Has the Arctic warmed up since the cold period in the 1960’s and 70’s? Certainly. But take away these temperature adjustments, none of which have ever been remotely justified, and it is questionable if the Arctic really is significantly warmer than the 1930’s and 40’s. Remember, too, that most of the Arctic has no temperature readings at all, and is simply infilled from stations hundreds of miles away. –Paul Homewood, Not A Lot Of People Know That, 4 February 2015
Christopher Booker thinks NOAA is distorting global land temperature data to inflate reported global warming, and fan the flames of climate alarmism. Dr. Kevin Cowtan contends Booker is wrong. Dr. Cowtan trusts that NOAA’s adjustments are justified and correct, and he also says they are too minor to be questionable. “Why would they do that?” he asks at the end of his video, meaning why would anyone commit fraud for an inconsequential difference in the result? –Dave Burton, Sea Level Info, 9 February 2015
I don’t know with certainty whether or not NOAA’s adjustments are all justified and correct, but I found Dr. Cowtan’s argument unpersuasive, for two reasons. The first reason is that he’s assuming that fraudulent intent is the only possible explanation for biased results, but it isn’t. If the results are biased to exaggerate warming, it could also be due to confirmation bias or simple error, by people with the best of intentions. However, Dr. Cowtan’s argument also depends on the adjustments being inconsequential, and they are not. I found that NOAA’s adjustments increased the reported warming by 35%. 35% is not inconsequential. –Dave Burton, Sea Level Info, 9 February 2015
1) The Fiddling With Temperature Data Is The Biggest Science Scandal Ever
The Sunday Telegraph, 8 February 2015
Christopher Booker
14986 Comments
When future generations look back on the global-warming scare of the past 30 years, nothing will shock them more than the extent to which the official temperature records – on which the entire panic ultimately rested – were systematically “adjusted” to show the Earth as having warmed much more than the actual data justified.
Two weeks ago, under the headline “How we are being tricked by flawed data on global warming”, I wrote about Paul Homewood, who, on his Notalotofpeopleknowthat blog, had checked the published temperature graphs for three weather stations in Paraguay against the temperatures that had originally been recorded. In each instance, the actual trend of 60 years of data had been dramatically reversed, so that a cooling trend was changed to one that showed a marked warming.
This was only the latest of many examples of a practice long recognised by expert observers around the world – one that raises an ever larger question mark over the entire official surface-temperature record.
Following my last article, Homewood checked a swathe of other South American weather stations around the original three. In each case he found the same suspicious one-way “adjustments”. First these were made by the US government’s Global Historical Climate Network (GHCN). They were then amplified by two of the main official surface records, the Goddard Institute for Space Studies (Giss) and the National Climate Data Center (NCDC), which use the warming trends to estimate temperatures across the vast regions of the Earth where no measurements are taken. Yet these are the very records on which scientists and politicians rely for their belief in “global warming”.
Homewood has now turned his attention to the weather stations across much of the Arctic, between Canada (51 degrees W) and the heart of Siberia (87 degrees E). Again, in nearly every case, the same one-way adjustments have been made, to show warming up to 1 degree C or more higher than was indicated by the data that was actually recorded. This has surprised no one more than Traust Jonsson, who was long in charge of climate research for the Iceland met office (and with whom Homewood has been in touch). Jonsson was amazed to see how the new version completely “disappears” Iceland’s “sea ice years” around 1970, when a period of extreme cooling almost devastated his country’s economy.
One of the first examples of these “adjustments” was exposed in 2007 by the statistician Steve McIntyre, when he discovered a paper published in 1987 by James Hansen, the scientist (later turned fanatical climate activist) who for many years ran Giss. Hansen’s original graph showed temperatures in the Arctic as having been much higher around 1940 than at any time since. But as Homewood reveals in his blog post, “Temperature adjustments transform Arctic history”, Giss has turned this upside down. Arctic temperatures from that time have been lowered so much that that they are now dwarfed by those of the past 20 years.
Homewood’s interest in the Arctic is partly because the “vanishing” of its polar ice (and the polar bears) has become such a poster-child for those trying to persuade us that we are threatened by runaway warming. But he chose that particular stretch of the Arctic because it is where ice is affected by warmer water brought in by cyclical shifts in a major Atlantic current – this last peaked at just the time 75 years ago when Arctic ice retreated even further than it has done recently. The ice-melt is not caused by rising global temperatures at all.
Of much more serious significance, however, is the way this wholesale manipulation of the official temperature record – for reasons GHCN and Giss have never plausibly explained – has become the real elephant in the room of the greatest and most costly scare the world has known. This really does begin to look like one of the greatest scientific scandals of all time.
2) Temperature Adjustments Transform Arctic Climate History
Not A Lot Of People Know That, 4 February 2015
Paul Homewood
We are told that the biggest sign of “climate change” is the rapidly warming Arctic, even called the World’s thermometer, proof that global warming cannot have stopped.
Certainly, the evidence of this from GISS is persuasive.

Yet it is well established that the Arctic warmed up rapidly during the 1930’s and 40’s, before temperatures plunged in the 1960’s and 70’s. James Hansen, himself, recognised this, as the graph below from his 1987 paper Global Trends of Measured Surface Air Temperature , showed.

So how much is what we have been seeing in recent years just part of that cycle? How much warmer is the Arctic now than it was 80 years ago?
Quite a lot, according to GISS.

But can we trust their figures? We saw previously how the temperature history for Paraguay, and a large slice of the surrounding region, had been altered as a result of temperature adjustments, which had significantly reduced historic temperatures and changed a cooling trend into a warming one.
I can now confirm that similar “cooling the past” adjustments have been carried out in the Arctic region, and that the scale and geographic range of these is breathtaking. Nearly every current station from Greenland, in the west, to the heart of Siberia (87E), in the east, has been altered in this way. The effect has been to remove a large part of the 1940’s spike, and as consequence removed much of the drop in temperatures during the subsequent cold decades.
The stations affected range from Nuuk, (51W), to Turuhansk (87E). In other words, nearly half way around the Arctic.
In the Appendix, there is a full set of the GHCN pages for each station, showing the size of the adjustments, but these two animated graphs, for Nuuk in Greenland, and Salehard, in Siberia, give a flavour. Note how the adjusted temperatures are suppressed for the period around 1940.

http://data.giss.nasa.gov/cgi-bin/gistemp/show_station.cgi?id=222233300000&dt=1&ds=12
http://data.giss.nasa.gov/cgi-bin/gistemp/show_station.cgi?id=222233300002&dt=1&ds=1

http://data.giss.nasa.gov/cgi-bin/gistemp/show_station.cgi?id=431042500000&dt=1&ds=12
http://data.giss.nasa.gov/cgi-bin/gistemp/show_station.cgi?id=431042500000&dt=1&ds=1
Altogether, out of the stations currently operational and with records since 1940, and located in Greenland, Iceland, northern Norway, Russia and Siberia (for the latter three, above 65N), there are 19 stations that have been adjusted this way to produce an artificial warming trend, and only 4 stations that have been unadjusted. No stations at all have been adjusted the other way. [Clarification – this covers Siberia as far as 87E).
Adjustments of a degree centigrade or more are common.
Temperature Adjustments
Can these temperature adjustments possibly be justified? It seems barely credible, given that so many have been altered. The normal logic of adjustment is that one station is an outlier, and needs to be homogenised back to the “pack”. Clearly the pack in this case have been altered. In Iceland, for instance, all four stations have been substantially adjusted.
We even find that Lerwick and Stornaway in the UK have had adjustments made.
Certainly the Iceland Met Office don’t agree that their temperature record is wrong and needs adjusting, and stated that some adjustments were “grossly in error”
They have a clear idea of how their temperatures have changed over the years. In their report, Past temperature conditions in Iceland, (from 1798 to 2007), they include the graphs below, and state:
The time from 1925 onwards is dominated by a very large cycle that does not show an overall significant warming, although the temperature rise of the last 20 years is considerable.
The 20th century warm period that started in the 1920s ended very abruptly in 1965. It can be divided into three sub-periods, a very warm one to 1942, a colder interval during 1943 to 1952, but it was decisively warm during 1953 to 1964.
The cold period 1965 to 1995 also included a few sub-periods. The so called “sea ice years” 1965 to 1971, a slightly warmer period 1972 till 1978, a very cold interval during 1979 to 1986, but thereafter it became gradually warmer, the last cold year in the sequence being 1995. Since then it has been warm, the warmth culminating in 2002 to 2003. Generally the description above refers to the whole country, but there are slightly diverging details, depending on the source of the cold air.

Figure 1. Annual temperature in Stykkishólmur 1798 to 2007. Note that the values prior to 1845 are interpolated from observations at other stations. The confidence is very low for the years before 1830 and the values are preliminary and should not be referenced. Work on quality improvement is ongoing. A few warm and cold years are highlighted

Figure 2. 7-year running means of temperature at three locations in Iceland, Reykjavík (red trace)), Stykkishólmur (blue trace) og Akureyri (green trace). Kuldakast = cold period. The first of the marked periods was the coldest one in the north (Akureyri), the second one was the coldest in Reykjavík. – http://en.vedur.is/climatology/articles/nr/1213
The IMO’s temperature record and account bears little resemblance to the heavily adjusted version that GISS now show, below. Recent years appear considerably warmer than the 1950’s, and you would not have guessed that the sea ice years of 1965-71 had ever taken place.

http://data.giss.nasa.gov/cgi-bin/gistemp/show_station.cgi?id=620040630000&dt=1&ds=12
The sea ice years are a well established phenomenon, and have been extensively researched. They were tied in with the Great Salinity Anomaly, which was described thus:
However, the GSA is certainly one of the most dramatic events of the century in the Norwegian Sea.
Many studies also confirm that the climatic changes in Iceland were part of a much more widespread cooling in Greenland and elsewhere. There are too many studies to show here, but they can be seen here.
In short, both the 1940’s warming and the bitterly cold years of the 1960’s and 70’s were real events. Certainly the latter had huge and devastating impacts on the Icelandic economy, particularly agriculture and fishing.
Trausti Jonsson is a senior meteorologist at the Iceland Met Office, specialising in climatology. This was his comment to me:
In 1965 there was a real and very sudden climatic change in Iceland (deterioration). It was larger in the north than in the south and affected both the agriculture and fishing – and therefore also the whole of society with soaring unemployment rates and a 50% devaluation of the local currency. In the questions above, the year 1965 is mentioned twice. It is very sad if this significant climatic change is being interpreted as an observation error and adjusted out of existence. I have been working for more than 25 years in the field of historical climatology and have been guilty of eager overadjustments in the past as well as other data handling crimes. But as I have lived through these sudden large climatic shifts I know that they are very real.
Has the Arctic warmed up since the 19thC, which is said to have been the coldest time since the Ice Age? Definitely.
Has the Arctic warmed up since the cold period in the 1960’s and 70’s? Certainly.
But take away these temperature adjustments, none of which have ever been remotely justified, and it is questionable if the Arctic really is significantly warmer than the 1930’s and 40’s.
Remember, too, that most of the Arctic has no temperature readings at all, and is simply infilled from stations hundreds of miles away. This gives the spurious adjustments at stations in Greenland, Iceland and elsewhere a much amplified effect, as the artificial warming trend introduced is transferred to these unmonitored areas.

Those warm decades coincided with the warm phase of the Atlantic Multidecadal Oscillation, just as the current warm period does. Equally, the cold phase of the AMO hit rock bottom in the 1970’s. It does not really take a genius to work out what will happen when the AMO turns cold again in the not too distant future.
I asked GHCN on several occasions to explain their adjustments, but despite acknowledgements that this would be done, they have remained unable to do so. Until they can, all of the evidence suggests that the official temperature trends for the Arctic, as published by GISS and others, are hopelessly flawed.
3) Globally Averaged Land Surface Temperatures, 1900-2014 (GHCN)
Sea Level Info, 9 February 2015
Dave Burton
Christopher Booker thinks NOAA is distorting global land temperature data to inflate reported global warming, and fan the flames of climate alarmism.
Dr. Kevin Cowtan contends Booker is wrong. Dr. Cowtan trusts that NOAA’s adjustments are justified and correct, and he also says they are too minor to be questionable. “Why would they do that?” he asks at the end of his video, meaning why would anyone commit fraud for an inconsequential difference in the result?
I don’t know with certainty whether or not NOAA’s adjustments are all justified and correct, but I found Dr. Cowtan’s argument unpersuasive, for two reasons.
The first reason is that he’s assuming that fraudulent intent is the only possible explanation for biased results, but it isn’t. If the results are biased to exaggerate warming, it could also be due to confirmation bias or simple error, by people with the best of intentions.
However, Dr. Cowtan’s argument also depends on the adjustments being inconsequential, and they are not. I digitized the endpoints of one of Dr. Cowtan’s graphs using WebPlotDigitizer and found that his own analysis proves NOAA’s adjustments are far from inconsequential. By comparing the adjusted and unadjusted versions of Dr. Cowtan’s graphs of globally averaged land surface temperatures, I found that NOAA’s adjustments increased the reported warming by 35%.
35% is not inconsequential.
Here are Mr. Booker’s recent articles complaining about NOAA’s temperature adjustments:
The Telegraph: 24 January, 2015
Climategate, the sequel: How we are STILL being tricked with flawed data on global warming
“Something very odd has been going on with the temperature data relied on by the world’s scientists,” writes Christopher Booker
The Telegraph: 7 February, 2015
The fiddling with temperature data is the biggest science scandal ever
“New data shows that the vanishing of polar ice is not the result of runaway global warming,” writes Christopher Booker
Here’s Dr. Cowtan’s video critique of Booker’s 24 January, 2015 article:
NOAA Paraguay data: https://www.youtube.com/watch?v=qRFz8merXEA
“A quick response to an article by Christopher Booker in the Telegraph.” 26 January, 2015
This is Dr. Cowtan’s graph (at 3:45 in the video), plus my comments (in green):
(click on the graph for a larger version)
This is a spreadsheet with endpoint data digitized from Dr. Cowatan’s graph:
http://www.sealevel.info/Cowtan_global_land_digitized_temperatures.xls
This is a spreadsheet with decadal data digitized from Dr. Cowatan’s graph:
http://www.sealevel.info/Cowtan_global_land_digitized_decadal1.xls
The digitized image, WebPlotDigitizer callibration data, and notes are here:
http://www.sealevel.info/Cowtan_global_land_digitized_decadal.zip
There’s a discussion of all this on the SkS blog, here.
One fact that seems to support Mr. Booker’s suspicion that NOAA is up to no good is their efforts to prevent the archiving of their data and documents:
https://stevengoddard.wordpress.com/2012/06/11/giss-blocking-access-to-archived-data-and-hansens-writings/#comment-487575


