DR. PAUL ALEXANDER | 16 Dec 2023
pathogenicity; body of evidence indicated optimal cutpoint of Ct 24/25; beyond 24 cycles, one would be detecting viral dust, fragments, old virus, non-infectious, non-lethal, non-consequential virus
I wrote this document in full. I am adding to some good work by SAGE HANA in questioning the PCR as well as Katherine Watt.
In summary, we closed society, we shut down economies, we closed schools, businesses knowing that the PCR test used was likely 95% false-positive (see body of evidence below) in terms of infectious, cultural, lethal virus. We removed 95 of every 100 persons from society in 2020, 2021, 2022 based on a flawed ‘process’ for PCR was never to be used as a diagnostic test. 95 of every 100 persons deemed ‘positive’, were likely never positive for infectious, lethal, consequential culturable virus.
Alexander COVID News-Dr. Paul Elias Alexander’s substack is a reader-supported publication. To receive new posts and support my work, consider becoming a free or paid subscriber.
Upgrade to paid
Like the lockdowns, the school closures, the business closures, all of the ‘shielding’, the masking and mask mandates, like for those, the PCR process was a failure. Every single COVID policy was a failure, capped off by the devastating unnecessary mRNA technology (and DNA platform) COVID gene injections (mRNA-lipid-nano particle/LPN platform complex).
Start reading here and you have permission from me to use this post to inform any discussions and you may print, publish it in any format you wish, as this was to share, inform, educate and for myself to be educated; please give me credit for this body of work, that is all; note people like Dr. Harvey Risch, Dr. Ramin Oskoui, Dr. Peter McCullough, Dr. Howard Tenenbaum, Dr. Roger Hodkinson etc. have been my guides throughout as I made sense of PCR:
________________________________
Title:
COVID-19 and RT-PCR cycle count (amplification) threshold value (Ct): problematic sensitivity with a Ct value of 30 and beyond in detecting replicating virus and signifying infectivity as well as pathogenicity; the body of evidence indicates/indicated an optimal cutpoint of Ct 24/25
Written by Dr. Paul Elias Alexander
Background
Severe acute respiratory syndrome coronavirus 2 (SARS-CoV-2) causes coronavirus disease 2019 (COVID-19).1 The spread of SARS-CoV-2 globally has led to millions of infections and hundreds of thousands of deaths. The majority of persons infected with SARS-CoV-2 are asymptomatic or have mild symptoms.2 However, infection can result in an atypical pneumonia in a small sub-set of higher-risk patients with infection as seen in typically elderly persons with underlying medical conditions or morbidly obese persons or younger persons with serious co-morbid conditions, leading to moderate to severe pulmonary failure with acute respiratory distress syndrome (ARDS).3
While the underpinning mechanisms of the spectrum of underlying disease is uncertain, evidence suggests that a hyper-inflammatory ‘dysregulated’ immune response (cytokine storm) characterized by elevated levels of cytokines (IL-1, IL-6, IL-10 etc.) can result in higher mortality.4 Given the limited therapeutic options and the ongoing quest for an effective vaccine, the focus has been on population mitigation strategies (e.g. social distancing, wearing of facial coverings, sheltering in place, school closures, varying degrees of societal lockdowns including full or partial etc.) to reduce the risk of transmission to high-risk subpopulations.
Needless to say, the extensive steps to contain the spread with mitigation strategies (public health containment and isolation measures) which could ease the strain on hospital systems and prevent overcrowding as well as allow patients with other health conditions to get care, has had extensive and harmful societal impacts. The steps have not worked to abate the virus in any measure and the virus flares up as soon as restrictions are eased. The societal ramifications of the lockdowns and restrictions have been extensive and catastrophic, including deaths of despair (from suicide, alcohol and drug overdoses), depression, anxiety, negative effects overall on general health and mental health, social isolation, loss of businesses and financial ruin, societal economic instability, loss of employment, elevated school dropouts due to the remote learning school model, physical abuse, child abuse and sexual abuse etc. There are also tremendous impacts on the highest-risk among us, this being the elderly who are typically residing in nursing (old-aged) homes and who are further restricted from family and contacts, with indications of deepening depression and escalation of dementia.
Taking reasonable and commonsense precautions as we move to safely re-open society and schools is the key consideration, as we protect the elderly and vulnerable among us. The results of the pandemic’s public health containment and isolation measures can be measured in large part by the number of cases, number of hospitalizations, number of ICU admissions, number of ventilators or ECMOs under use, and ultimately, the number of deaths. Exactly how the epidemiology is changing in a localized area is a key consideration if public policy decisions are to be made to relax or enhance the infection control containment measures. As one would imagine, this demands a clear understanding of the duration of infectivity. The result of a positive test for SARS-CoV-2 virus is quarantine (isolation) for usually up to 14 days (CDC has proposed adjusting downwards to 7 or 10 days pending a negative test), as well as contact tracing of all contacts. This results in similar shelter-in-place for known contacts and can effectively grind societal functioning to a halt. This no doubt takes enormous human resources and time, as well as removes persons from their usual day to day lives and economies, and this has significant implications for how the society functions. Losses accrue personally and societally. It is therefore imperative to have the best evidence-informed data and information on when it is safe to terminate isolations precautions so that societies can resume normal functioning. This depends on screening and accurate diagnostic testing results that can provide an optimal reading of infectivity (contagiousness) for this is a rate limiting step as we search for an effective drug treatment as well as await vaccine implementation.
Primer on cycle count threshold value (Ct) values and the concern with Ct values
Currently, we diagnose COVID-19 illness using real-time reverse transcription polymerase chain reaction (RT-PCR) tests that are directed at SARS-CoV-2 virus (for the qualitative detection of nucleic acid by amplification), by testing samples drawn from upper and lower respiratory specimens (from the nasopharynx or respiratory sites that are swabbed, from sputum, lower respiratory tract aspirates, bronchoalveolar lavage, and nasopharyngeal wash/aspirate or nasal aspirate).5 The specimens are taken from persons suspected of COVID-19 by their healthcare attendant. In brief, the RNA that is isolated and purified from the person’s upper and lower respiratory specimens is reverse transcribed to cDNA.5 From there, it is amplified and during the process, a fluorescent signal is generated and this process occurs for subsequent PCR cycles. The detection of viral RNA assists in the diagnosis of illness and also yields epidemiological and surveillance information.5
The RT-PCR test gives a binary outcome of either positive or negative. There are growing concerns that results may be positive while at the same time not picking up viable SARS-CoV-2 virus and as such, not accurately indicative of contagiousness. Here lies the core concern with the current RT-PCR testing and the use of elevated and potentially suboptimal cycle count threshold value (Ct) values (a proxy or surrogate measure of the amount of virus that is present). The public policy decisions made based on the test results are far reaching and as such, we must get this right. Currently, the CDC5 has set a Ct value of up to 40 cycles and this is typically the cut point described in the literature. The Ct (as a surrogate for viral load) is the number of cycles that is required to amplify the viral RNA (cycles needed to yield a positive fluorescent signal) so as to arrive at detectable levels.6 Moreover, it can be described as the cycle number when the sample fluorescence has exceeded a chosen threshold above the calculated background fluorescence. The interpretation of Ct value is such that the lower the Ct value of a specific gene, the more the gene exists in the sample (less cycles needed for amplification) and it is this Ct value that has largely driven the categorization of a case as being ‘positive’ based on RT-PCR testing. As mentioned, typically at up to 40 cycles, the test is designated as ‘positive’.5
However, the critical challenge has been how to accurately link viral RNA load from the RT-PCR test that is denoted by the Ct, with actual infectiousness of the person. This has dramatic and far-reaching implications for restricting a person (s) and societal structure and function during the pandemic. Specifically, the Ct value directs containment measures such as quarantine duration (a 14-day removal from societal function), the extensiveness of contact tracing and their quarantine and removal from societal functioning, and discharge from hospital infection control settings etc.
The stakes are very high with regards to the Ct value that is utilized in a setting and across settings, and therefore it is imperative to get the association between infectiousness, viral load, and Ct count accurate. Importantly, research is accumulating that implies a direct link between the Ct marker (as indicative of viral load) and the severity of disease. For example, one recent review7 examined prediction of the probable prognosis and infectiousness for patients with COVID-19 using the Ct, and how the Ct could be leveraged and would assist in optimal clinical management decisions. After examining 18 relevant studies, researchers reported that the lower the Ct value, the higher the viral load, and the more it would be related to a poorer outcome, including increased mortality (and presence of biochemical and haematological markers). The Ct value appeared closely linked to the evolution to severe disease and associated complications. They argued that while RT-PCR test has utility in diagnosis, the inclusion of the Ct values would confer additional benefits to clinicians and decision-makers in making clinical and patient-management decisions for COVID-19 positive patients. This would also be informative and instructive in crafting more accurate infection control and public health as well as occupational health decisions.7
Emerging questions surrounding Ct values
With this introduction, we are left with very important questions around the Ct value such as: Have we been designating thousands or even millions of COVID-19 cases that are not actually positive or ‘infectious’, as being infectious? This is the primary vexing question. Have our societal containment measures been needlessly applied and with crippling societal effects? What is the optimal Ct threshold as it is argued that anything over a Ct of 30 is not accurate as it is not detecting current infectious SARS-CoV-2 virus. A repeated question has been why has the CDC not set a standard Ct threshold for all US settings and why does it use an overly sensitive Ct value of up to 40 when this is more likely non-infectious SARS-CoV-2 virus or likely picking up fragments or dust or non-SARS-CoV-2 virus. Is it replication-competent virus or actually viral dust, viral debris, or dead nucleotides from the upper respiratory specimens that elevated Cts are detecting? Is it fragments from another infection? Old inactive fragments? What is it detecting at a threshold of a Ct value of 40? There is a growing consensus that a Ct value above 30 cycles is a ‘grey’ area in which a positive test result is very suspect and is not reliable. Moreover, why do global nations and settings also employ varying Ct thresholds, thus making an accurate comparative assessment of the epidemiologies impossible.
Others question, was the RNA that was amplified during the RT-PCR testing actually from SARS-CoV-2 virus? This is catastrophic if true, given the very severe ramifications we have already seen accrue upon our societies due to restrictions. Some argue that the gene that is utilized in the RT-PCR test is not explicit to COVID-19 and as such, is capable of sensing a very broad spectrum of other coronaviruses. Leftovers from prior infection or even present infection that presents no specific risk? As such, non-culturable or non-viable viral RNA that has remained after infectious virions have been cleared. No doubt this question is a key question for follow-up actions that are far-reaching. Some argue it is not really a ‘false-positive’ for at some time in the past, this person could have been positive, but that they are not infectious in the present. Again, a key distinction that cannot be lost. All this to say that the emerging key question remains, which is what is an optimal or most definitive Ct value for decision-making, and as critically, in ascertaining whether the person is indeed infectious and needs to be quarantined?
Key considerations in interpretation of Ct values
As we consider this issue of optimal Ct cut point as a surrogate of viral load, infectivity and prognosis, we have to consider several factors. Chang et al.8 raises key considerations and caution as we interpret the Ct value that indeed, cannot be overlooked. While the Ct value is used to guide ‘positive’ versus ‘negative’ result classifications, some argue that the Ct value does not entirely reflect a true viral load and should be best regarded as a surrogate marker (useful proxies for infectivity). Chang et al.8 explains what should be considered in interpreting the Ct value:
i) There exists no absolute or constant Ct value cut point (it is non-standardized), and Ct cut points or thresholds can vary based on the diagnostic reagent and even for the same gene;
ii) Errors emerge of approximately 1-2 cycles based on a host of factors, including the skill of the assessor/technician; such uncertainty for example, is present if a Ct cut point was 35 and the result is 34-36, then interpretation could be false positive or false negative (either direction);
iii) The Ct value is inversely proportional to the amount of the target gene, and as such there is a problem of incorrect interpretation e.g. as false negative when in the early stages of SARS-CoV-2 infection, there is less viral multiplication, or the swabbing methods may not be accurate;
iv) There should be standard operating procedures adopted with a central decision-making potentially emerging from the lead government agency (s). Such leadership should urgently move to make the Ct value uniform (standardized) relative to the reagent used and the viral concentration;
v) A call has been made to secure two or more swabs from at least two sites e.g. nasopharyngeal and throat swabs, and from each patient and perform consecutive tests (keeping the patient in isolation) so as to resolve a false-negative result, given the possibility of early stage of viral replication or suboptimal swabbing;
vi) Elevated false-negatives or false-positives that plague the RT-PCR test are typically due to a) suboptimal and inconsistent Ct cut points, b) gene selection, c) storage temperature, d) the swabbing method (specimen collection quality is impacted by irregularities in swab taking) accuracy, e) reaction conditions, f) reagents that were not assessed for accuracy, g) location of the smear (upper versus lower respiratory tract), h) whether taken too early in infection, i) the gap between collection and then processing (transport duration), j) the primers used in the amplification or k) being tested at an early stage of viral replication (infection). As an example, if two samples are taken from the same patient at the same time, yet transported at different temperatures, then this can distort the Ct values. The cycle conditions may be materially different and as such, we have to be weary that these factors may each introduce variation.
Existing evidence on Ct cut points (thresholds)
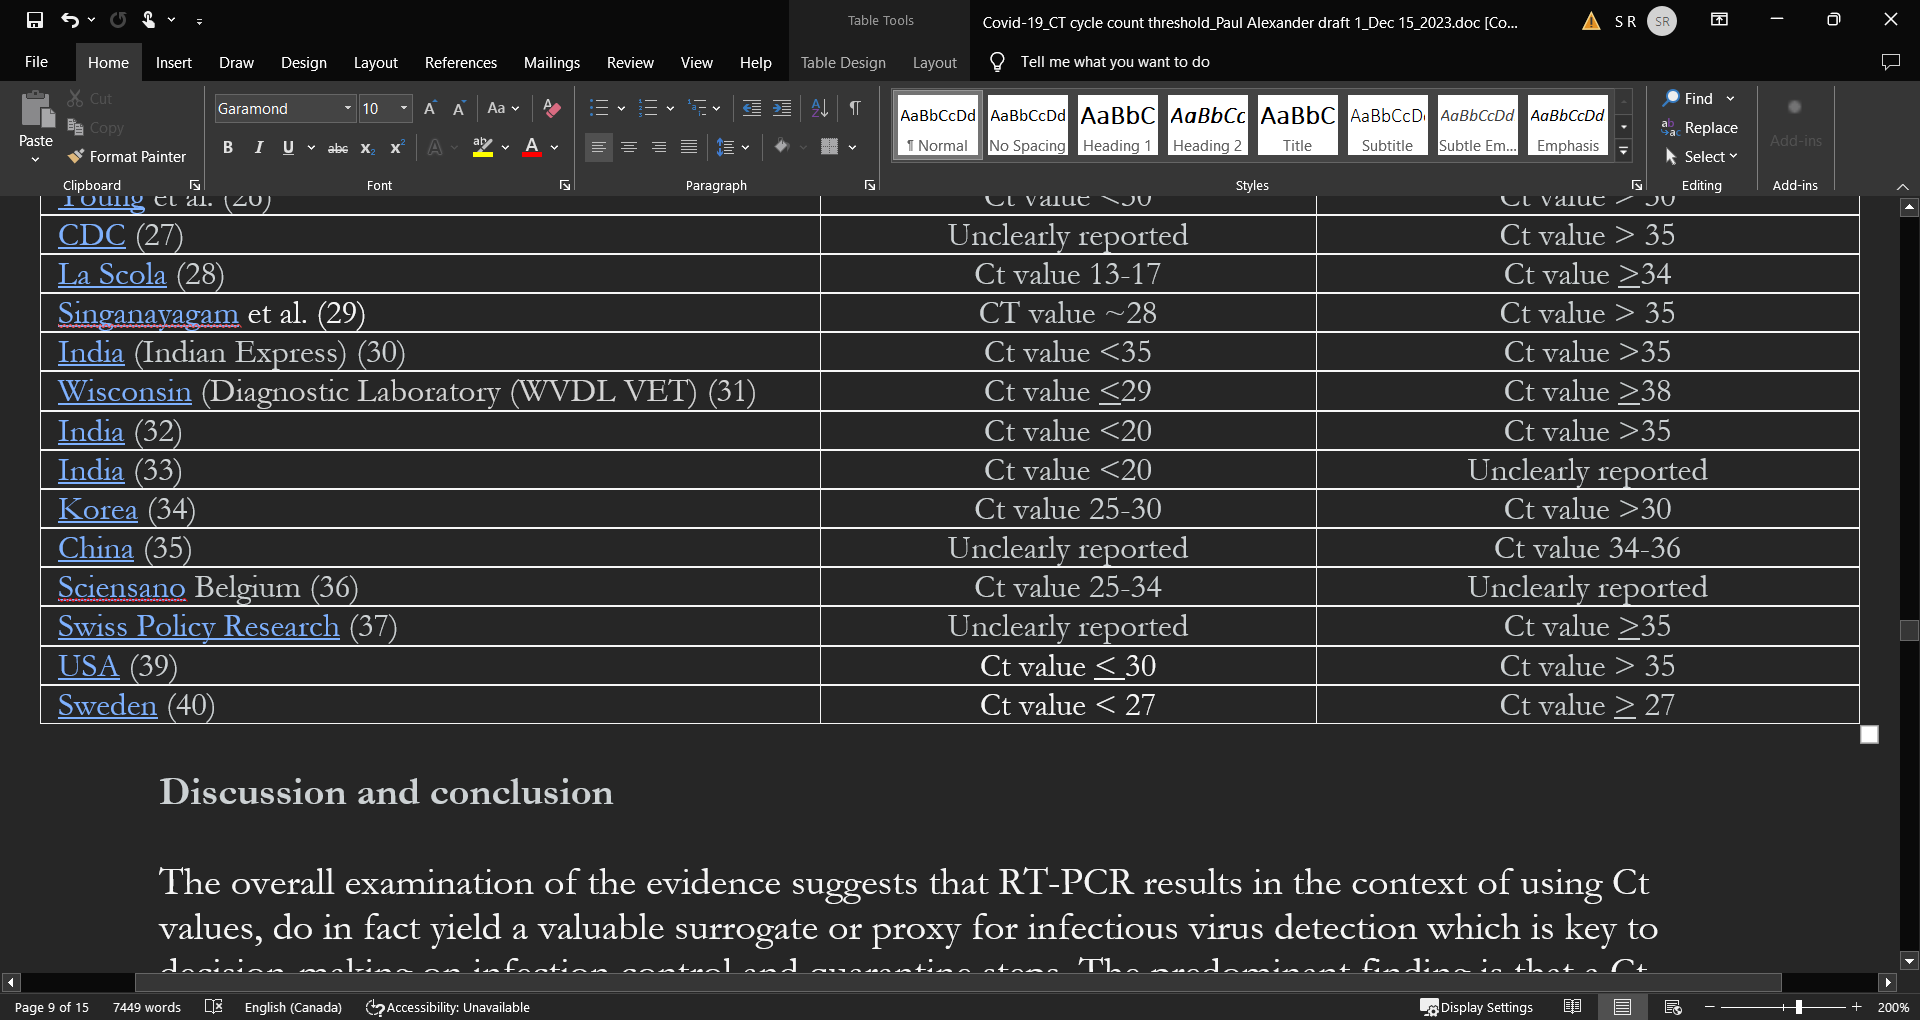
What does the existing literature indicate in terms of a Ct value that could more optimally, denote infectiousness (see Table 1)?
Researchers conducted a retrospective cohort study at a tertiary academic medical center in New York City9 and examined all of the patients who attended the emergency department (March to April 2020). Researchers were interested primarily in the relationship between the genomic load in hospitalized COVID-19 positive patients with pneumonia, and subsequent disease sequalae. Researchers classified Ct values using RT-PCR testing into 3 SARS-CoV-2 viral load groups using tertiles of i) low viral load ³34.2 Ct, ii) intermediate viral load, 27.7-34.2 Ct, and iii) high viral load, £27.7 Ct (a composite outcome of death or discharge to hospice care, use of mechanical ventilation or extracorporeal membrane oxygenation (ECMO) was utilized). Based on 314 patients (65% male and median age 64), they concluded that an elevated genomic load when patients presented, was able to predict more adverse outcomes, after adjusting for age, comorbidities, and severity of illness. Based on the results, a high load was associated with a lower Ct value and predicted more severe outcomes.9
Canadian researchers conducted a retrospective cross-sectional study10 by taking SARS-CoV-2 RT-PCR confirmed positive samples (n=90) and determined their ability to infect Vero cell lines (cultured cells). Researchers found that 26 samples (29%) were culture positive with viral growth and when compared to culture-negative samples, the positive samples had lower Ct values (Ct 17 vs. Ct 27; p<0.001) and shorter STT (3 days vs. 7 days; p<0.001). Researchers reported no growth in the samples with a Ct value > 24 or STT > 8 days, concluding that a Ct value > 24 and duration from symptom onset > 8 days are associated with a very low risk of culturing virus, and thus lower risk of infectivity. For every 1-unit increase in Ct value, the odds ratio for infectivity decreased by 32%. The high specificity of Ct and STT suggests that Ct values > 24, along with duration of symptoms > 8 days, may be used in combination to determine duration of infectivity in patients. Bullard et al.10 essentially concluded that patients are likely not contagious with Ct value > 24 or 25 given that the virus is not detected in culture above this value.
Researchers in the US11 conducted an observational study (retrospective) of patients hospitalized with COVID-19 (n=678) in New York City. They assessed SARS-CoV-2 viral load using Ct values from a RT-PCR assay using nasopharyngeal swab samples, and sought to compare patient characteristics and subsequent outcomes in the patients with high, medium, and low viral loads on admission. They aim was to determine if viral load was independently linked to the risk of intubation and in-hospital mortality.11 They found that more elevated viral load was associated with increasing age, comorbidities, smoking status, and receipt of recent chemotherapy. In terms of the association between viral load, CT value, and outcomes, researchers reported that the in-hospital mortality was 35% with a high viral load (Ct value <25 in 220 patients), 17.6% with a medium viral load (Ct value 25-30 in 216 patients), and 6.2% with low viral load (Ct value>30 in 242 patients, p<0.001). Intubation risk also escalated in persons with a high viral load relative to those with a medium or low viral load (p<0.001). High viral load with a lower Ct value was independently associated with mortality (aOR 6.05; 95% CI 2.92-12.52; p<0.001) and intubation (aOR 2.73; 95% CI: 1.68-4.44; p<0.001) in further multivariable modelling.11 As reported, there is a direct association between SARS-CoV-2 viral load on admission and Ct values, and this association appears to stably and independently predict worse outcomes like in-hospital mortality and risk of intubation.
These results were similar to what was reported by Fajnzylber et al.12 who examined a combination of 231 hospitalized, symptomatic non-hospitalized, and recovered COVID-19 patients to assess the relationship between SARS-CoV-2 viral load and risk of disease progression. One can also make the extrapolation of viral load to CT values though CT was not reported in this study. Researchers however reported that in the hospitalized patients, a higher prevalence of detectable SARS-CoV-2 plasma viral load is associated with worse respiratory disease severity, a lower absolute lymphocyte counts, and increased markers of inflammation (e.g. C-reactive protein and IL-6). SARS-CoV-2 viral loads, especially plasma viremia, are associated with increased risk of mortality. The data underscores the benefits of risk stratification by viral load (and potentially CT values associated with viral load).
Jaafar et al.13 reported on the correlation between 3790 quantitative RT-PCR positives samples and positive cell cultures, including 1941 SARS-CoV-2 isolates. They reported that when the Ct value was 25, as many as 70% of patients remain positive in culture and that when the Ct value was 30, there was a dramatic drop to 20%. When CT was 35, less than 3% of cultures were positive.13 They affirmed that elevated Ct values (beyond 25 and approaching 30) are mainly associated with low viral loads. They also commented on the issue of rare instances when the RT-PCR is positive beyond 10 days and this likely when the Ct value is > 30, asserting that these rare occurrences should not materially shape public health decisions.
Rhee et al.14 discussed the challenge of handling recurring situations whereby SARS-CoV-2 patients consistently test positive with RT-PCR tests for several weeks and even months after their clinical recovery, and the evidence suggests that these positive tests do not accurately indicate virus that is capable of replicating. Contagiousness is greatest at the time of onset of symptoms14 and the ability to transmit declines precipitously soon after symptom onset to a near-zero at about 10 days post symptom onset. This is so for mild to moderately ill persons and extends to about 15 days in severely ill or critically ill persons and those immunocompromised.14 There is evidence of the longest duration of infectivity from symptom onset to be approximately 20 days.14 As reported by researchers,14 evidence suggests that the median period of incubation of SARS-CoV-2 is 4 to 5 days (IQR of 2 to 7 days),15,16 and over 95% of persons who are infected and who go on to develop symptoms do so by the 12th day.17 Detection of viral RNA in the respiratory tract happens at about 2 to 3 days prior to symptom appearance and peaks at symptom onset, to then decline during the next 7 to 8 days.18-21 For example in the German study20 whereby researchers conducted a virologic analysis of serial samples from 9 young to middle-aged hospitalized patients with epidemiologically linked RT-PCR–confirmed SARS-CoV-2 virus (all patients had established contact with an index case), researchers found that all naso- and oropharyngeal swabs taken during the initial 5 symptomatic days were positive. They reported that detection rates declined to 40% following day 5, but no virus was isolated from samples after day 8.
Evidence indicates that asymptomatic and pre-symptomatic persons can transmit virus prior to symptom onset.22,23 In terms of Ct value, it is inversely associated with the amount of nuclei acid in the sample, and researchers have reported that an increase in Ct value of ~3.3 is directly related to a 10-fold decrease in the amount of nucleic acid.24 Rhee et al.14 outlined research suggestive that a CT value of 20 to 30 is found in early stages of infection, and Ct values increase markedly soon after and is indicative of progressively declining amounts of viral RNA,25 “as the immune response clears the infection”.
Young et al.26 conducted a prospective observational study of 100 patients with confirmed COVID-19 who were admitted to public hospitals in Singapore. They found that culturing virus was not possible in samples with CT values >30. Moreover, approximately 90% of the samples drawn after 14 days from symptom onset revealed CT values of more than 30.
The US CDC has reported that they were unable to isolate culture replication-competent virus from a group of adult patients (varying ages and severity of illnesses) when taken >9 days from the time of symptom onset.27 They reported no success in culturing any virus above a Ct value of 35.
La Scola et al.28 conducted a French study during February and March of 2020 on 4384 clinical samples and a total of 183 samples testing positive by RT-PCR, including 9 sputum samples and 174 nasopharyngeal swabs from 155 patients, were inoculated in cell cultures. They reported that among the 183 samples inoculated in the studied period of time, 129 led to virus isolation. Researchers reported a significant relationship between the Ct value and the culture positivity rate. They found that samples with Ct values of 13 to 17 all led to a positive culture and the positivity rate then declined progressively according to Ct values to 12% at a CT value of 33. They were unable to obtain culture from samples with Ct > 34 and were reported as consistent with a low viral load. Researchers concluded that in patients with a CT value of >34, they are at very low risk of excreting infectious viral particles (do not excrete particles) and therefore should be discharged.
Singanayagam et al.29 examined the duration of infectiousness and its correlation with RT-PCR cycle threshold values in cases of COVID-19 in England between January to May 2020. Researchers cultured virus from 324 upper respiratory tract samples in 253 cases testing positive for SARS-CoV-2 by RT-PCR. They found a strong association between Ct values and cultivable virus (CT values were lower with higher viral load) whereby the likelihood of culturing virus was reduced to 8% in samples with Ct values > 35 and the probability of culturing virus declines to 6% 10 days after symptom onset.29 Up to day 7 after symptom onset, the mean Ct value was 28.2 and in the 2nd week (days 8-14), the mean Ct value was 30.6. After 2 weeks, the Ct value was 31.6. Researchers reported that “the estimated OR of recovering infectious virus decreased by 0.67 for each unit increase in Ct value (95% CI: 0.58–0.77)”.29 They also reported that the estimated likelihood of virus recovery from samples with Ct values > 35 was 8.3%.
As reported in the Indian Express,30 the ICMR (ICMR’s National Institute of Occupational Health (NIOH), Ahmedabad) is using a Ct value of 35 as positive, above 35 as negative, and a Ct value of 35 needing repeat testing. They reported that “A low value, therefore, means a high viral load and vice versa”.
A Wisconsin diagnostic laboratory document suggests an optimal Ct value of < 29.31
In an article published in “Thehindu” website,32 a Ct value of 20 or less than 20 suggests high viral load and can be very informative in whether the person can be isolated in the home setting or admitted to hospital. Dr. Gagandeep Kang, Professor of Microbiology at CMC Vellore, stated “In my view, there is a relationship between the cycle threshold value and the probability of shedding infectious virus, the lower the number the higher the likelihood…that said, by [Ct value] 35 you will unlikely be infected.”
In the ‘Times of India’33 publication, a Ct value of 20 or below is indicative of a high viral load. The publication reports that “if the value is between 20 and 25, home isolation can be advised…hospital admission is a must in cases where the value is less than 20”.
Similarly, a recent report from the Korean CDC34 examined 285 confirmed patients who had a ‘re-positive’ test (60% after screening, 40% with symptoms) following discharge (up to 81 days after initial symptom onset). They found that 90% of the re-positives had Ct-values >30, the remaining 10% had Ct values ranging between 25 and 30. Importantly, when researchers tried to culture in 180 of the re-positive cases, they were unable to in any. Moreover, of the 790 contacts of the 180 re-positive patients, 3 tested positive and also reported a different exposure. From these findings, researchers concluded that it is not necessary to isolate re-positive cases or their contacts.
An examination of 9 asymptomatic cases35 found during screening in Wuhan (positive for N gene and ORF1ab gene and IgG positive) revealed “no transmission in the household before detection of this cases, despite having lived closely together during the lockdown before detection”. When the cases were detected, the mean Ct value in the 9 patients was “36.42 ± 2.06 (ORF1ab gene, range 31.27-38.89) and 34.87 ± 3.73 (N gene, range 27.30-39.47)”.
The Belgium publication (Sciensano)36 outlines that the optimal cut points for infectiousness resides between 25 and 34 and depend on testing factors and heavily on the type of sample e.g. whether sampled from the lower versus upper respiratory tract.
Swiss policy research37 found that if an RT-PCR test yields a positive result when the Ct cycle threshold is 35 or more, then the likelihood that the person is infectious is <3%. It thus has a 97% of being a false-positive.
A virologist at the University of California39 declared that any Ct value greater than 35 is too sensitive and is more likely detecting genetic fragments, leading another to stipulate that it should be set at 30, or less. Persons working at the Wadsworth Center, New York’s state laboratory, reported that 872 positive tests were identified in July using a Ct of 40. However, they also reported that if the Ct cut point was reset to 35, approximately “43 percent of those tests would no longer qualify as positive. About 63 percent would no longer be judged positive if the cycles were limited to 30”. In addition, in Massachusetts, “from 85 to 90 percent of people who tested positive in July with a cycle threshold of 40 would have been deemed negative if the threshold were 30 cycles…none of those people should be contact-traced, not one.”39 It is reported that many laboratories in the US use Ct cut points of up to 45 cycles.39
Swedish researchers40 analyzed a cohort of 9449 employees at a University Hospital in Stockholm, Sweden for SARS-CoV-2 RNA and antibodies, and linked the screening results to sick leave records.
The screening test results were categorized as strongly positive with a CT value of < 27, and weakly positive with a value of >27 (based on the median Ct value). Researchers reported that healthcare workers with elevated amounts of SARS-CoV-2 virus based on the Ct value had the highest risk for sick leave in the 2 weeks following testing while workers with low levels of virus had the highest risk for sick leave in the past 3 weeks prior to testing. They concluded that screening asymptomatic healthcare employees for elevated levels of SARS-CoV-2 virus using Ct values will help in identifying contagious pre-symptomatic employees who will go on to develop disease in the upcoming weeks.
Table 1: SARS-CoV-2 viral load (high) and CT values association as a surrogate for infectiousness (suggestive of a threshold)
Study’s 1st author (reference #)
Ct values (cut points) reported in examined study samples beyond which infectiousness declines and below prognosis is worse given higher viral loads
A
Suggested high Ct values (and difficulty in isolating culture replication-competent virus) indicating low viral load and low risk of infectivity (transmission)

Discussion and conclusion
The overall examination of the evidence suggests that RT-PCR results in the context of using Ct values, do in fact yield a valuable surrogate or proxy for infectious virus detection which is key to decision-making on infection control and quarantine steps. The predominant finding is that a Ct value of up to 40 is currently used globally to guide a designation of ‘positive’ status. The CDC uses this cut point of 40 cycles to aid in denoting positivity.5 We however think that this is too sensitive and remains at risk of detecting non-viable SARS-CoV-2 based on the examined evidence. When less than the reported thresholds in Table 1 column A, infectivity (contagiousness) is high and outcomes are worse and above the Ct thresholds in column B, infectivity is very low (if at all existent once above a Ct value of ~30) and viral load is very low. As observed in Table 1 and the provided evidence, it appears that a Ct value threshold of between ~25 to 30 is more reflective of high SARS-CoV-2 viral load and as discussed in the literature, a likely indication of greater infectivity. On balance, a Ct value of 24 to 25 (as a surrogate for viral load and pathogenicity) appears optimal when all of the reported evidence is considered, and beyond a Ct value of 30, we propose that infectivity drops off dramatically, as per the reported evidence. This is in line with the contention by Bullard et al.9 who stipulated that COVID-19 patients with a Ct value > 25 are not infectious given the virus cannot be detected in culture beyond a Ct of 25.
Moreover, the body if evidence suggests that beyond cycles of 24 to 25, lethality or severity drops of dramatically. This is the key that we have been arguing which is that we want a test that tells us how infectious you are and how lethal, pathological. We also propose at least 10 days eviction that is in line with what has been reported by Jaafar et al.13 Note, Rhee et al.14 reported no virus being isolated from samples after day 8.
In summary, we sought to summarize the evidence and offer a guide and based on the reported evidence, it may well be given the consistency of the reported evidence, that Ct values above 30 yield no value as an accurate measure of infectiousness or prognosis. We question the CDC’s continued use of a Ct value of up to 40 in the RT-PCR testing which based on our examination, is more likely a false-positive (potentially old infections of viral dust or fragments), and non-viable, non-consequential, non-informative SARS-CoV-2 virus as to contagiousness and prognosis.5,38 Our aim is to share this review with public policy and clinician decision-makers in the hopes that this could enhance the debate on the use of Ct values in decision-making, which could potentially be used to guide patient care and decisions around optimal quarantine (sheltering-in-place) of COVID-19 positive cases. We think this Ct value (once interpreted accurately and standardized) is very valuable as a means to help more accurately gear and target much needed resources during this pandemic emergency.
Accurate definition of the duration of infectivity with SARS-CoV-2 can have positive implications for public health and infection control especially at hospital and healthcare type institutions. Importantly, it could greatly reduce unnecessary quarantine (restrictions) and massive demand on contact tracing and testing, as well as mitigate the mass hysteria that is ongoing surrounding the need for quarantine and what the optimal (evidence-based) duration should be.
We end by cautioning the use of the Ct value for while the Ct value is inversely correlated with the amount of viral RNA, there is a lack of standardization and uniformity across tests. This is a huge problem and constrains interpretation and we have to be cautious especially around the elevated false positives and the limitations and restrictions (especially for large groups) such places on a society. Often, RT-PCR results underpinned by the Ct value places constraints when persons present no risk of infection to others.41,42 We agree that low levels of viral RNA will translate into an elevated Ct value, but the actual and accurate value depends on a host of factors as outlined above by Chan et al.,8 and particularly the test characteristics.
References
1. Lai CC, Shih TP, Ko WC, Tang HJ, Hsueh PR. Severe acute respiratory syndrome coronavirus 2 (SARS-CoV-2) and corona virus disease-2019 (COVID-19): the epidemic and the challenges. International journal of antimicrobial agents. 2020 Feb 17:105924.
2. Ferretti L, Wymant C, Kendall M, Zhao L, Nurtay A, Abeler-Dörner L, Parker M, Bonsall D, Fraser C. Quantifying SARS-CoV-2 transmission suggests epidemic control with digital contact tracing. Science. 2020 May 8;368(6491).
3. Nieman DC. COVID-19: A tocsin to our aging, unfit, corpulent, and immunodeficient society. Journal of Sport and Health Science. 2020 May 8.
4. Mehta P, McAuley DF, Brown M, Sanchez E, Tattersall RS, Manson JJ, HLH Across Speciality Collaboration. COVID-19: consider cytokine storm syndromes and immunosuppression. Lancet (London, England). 2020 Mar 28;395(10229):1033.
5. CDC 2019-Novel Coronavirus (2019-nCoV) Real-Time RT-PCR Diagnostic Panel. Catalog # 2019-nCoVEUA-01 1000 reactions. CDC-006-00019, Revision: 06. Effective 12/01/2020. CDC/DDID/NCIRD/ Division of Viral Diseases.
6. SARS-CoV-2 Cycle Threshold: A Metric That Matters (or Not). url: https://www.aacc.org/cln/cln-stat/2020/december/3/sars-cov-2-cycle-threshold-a-metric-that-matters-or-not (Accessed on December 11th 2020).
7. Rao SN, Manissero D, Steele VR, Pareja J. Correction to: A Systematic Review of the Clinical Utility of Cycle Threshold Values in the Context of COVID-19. Infect Dis Ther. 2020 Sep;9(3):587. doi: 10.1007/s40121-020-00328-z. Erratum for: Infect Dis Ther. 2020 Sep;9(3):573-586. PMID: 32809140; PMCID: PMC7431897.
8. Chang MC, Hur J, Park D. Interpreting the COVID-19 Test Results: A Guide for Physiatrists. Am J Phys Med Rehabil. 2020;99(7):583-585. doi: 10.1097/PHM.0000000000001471. PMID: 32427600; PMCID: PMC7268832.
9. Zacharioudakis IM, Prasad PJ, Zervou FN, Basu A, Inglima K, Weisenberg SA, Aguero-Rosenfeld ME. Association of SARS-CoV-2 Genomic Load with COVID-19 Patient Outcomes. Ann Am Thorac Soc. 2020 Oct 29. doi: 10.1513/AnnalsATS.202008-931RL. Epub ahead of print. PMID: 33119425.
10. Bullard J, Dust K, Funk D, Strong JE, Alexander D, Garnett L, Boodman C, Bello A, Hedley A, Schiffman Z, Doan K, Bastien N, Li Y, Van Caeseele PG, Poliquin G. Predicting infectious SARS-CoV-2 from diagnostic samples. Clin Infect Dis. 2020 May 22:ciaa638. doi: 10.1093/cid/ciaa638. Epub ahead of print. PMID: 32442256; PMCID: PMC7314198.
11. Magleby R, Westblade LF, Trzebucki A, et al. Impact of SARS-CoV-2 Viral Load on Risk of Intubation and Mortality Among Hospitalized Patients with Coronavirus Disease 2019 [published online ahead of print, 2020 Jun 30]. Clin Infect Dis. 2020; ciaa851. doi:10.1093/cid/ciaa851.
12. Fajnzylber J, Regan J, Coxen K, et al. SARS-CoV-2 viral load is associated with increased disease severity and mortality. Nat Commun. 2020;11(1):5493. Published 2020 Oct 30. doi:10.1038/s41467-020-19057-5.
13. Jaafar R, Aherfi S, Wurtz N et al. Correlation Between 3790 Quantitative Polymerase Chain Reaction–Positives Samples and Positive Cell Cultures, Including 1941 Severe Acute Respiratory Syndrome Coronavirus 2 Isolates. Clinical Infectious Diseases. CID 2020. Correspondence.
14. Rhee C, Sanjat Kanjilal, Meghan Baker, Michael Klompas. Duration of Severe Acute Respiratory Syndrome Coronavirus 2 (SARS-CoV-2) Infectivity: When Is It Safe to Discontinue Isolation?, Clinical Infectious Diseases. CID 2020. ciaa1249, https://doi.org/10.1093/cid/ciaa1249.
15. Guan WJ, Ni ZY, Hu Y, Liang WH, Ou CQ, He JX, Liu L, Shan H, Lei CL, Hui DSC, Du B, Li LJ, Zeng G, Yuen KY, Chen RC, Tang CL, Wang T, Chen PY, Xiang J, Li SY, Wang JL, Liang ZJ, Peng YX, Wei L, Liu Y, Hu YH, Peng P, Wang JM, Liu JY, Chen Z, Li G, Zheng ZJ, Qiu SQ, Luo J, Ye CJ, Zhu SY, Zhong NS; China Medical Treatment Expert Group for Covid-19. Clinical Characteristics of Coronavirus Disease 2019 in China. N Engl J Med. 2020 Apr 30;382(18):1708-1720. doi: 10.1056/NEJMoa2002032. Epub 2020 Feb 28. PMID: 32109013; PMCID: PMC7092819.
16. Li Q, Guan X, Wu P, Wang X, Zhou L, Tong Y, Ren R, Leung KSM, Lau EHY, Wong JY, Xing X, Xiang N, Wu Y, Li C, Chen Q, Li D, Liu T, Zhao J, Liu M, Tu W, Chen C, Jin L, Yang R, Wang Q, Zhou S, Wang R, Liu H, Luo Y, Liu Y, Shao G, Li H, Tao Z, Yang Y, Deng Z, Liu B, Ma Z, Zhang Y, Shi G, Lam TTY, Wu JT, Gao GF, Cowling BJ, Yang B, Leung GM, Feng Z. Early Transmission Dynamics in Wuhan, China, of Novel Coronavirus-Infected Pneumonia. N Engl J Med. 2020 Mar 26;382(13):1199-1207. doi: 10.1056/NEJMoa2001316. Epub 2020 Jan 29. PMID: 31995857; PMCID: PMC7121484.
17. Lauer SA, Grantz KH, Bi Q, Jones FK, Zheng Q, Meredith HR, Azman AS, Reich NG, Lessler J. The Incubation Period of Coronavirus Disease 2019 (COVID-19) From Publicly Reported Confirmed Cases: Estimation and Application. Ann Intern Med. 2020 May 5;172(9):577-582. doi: 10.7326/M20-0504. Epub 2020 Mar 10. PMID: 32150748; PMCID: PMC7081172.
18. Zou L, Ruan F, Huang M, Liang L, Huang H, Hong Z, Yu J, Kang M, Song Y, Xia J, Guo Q, Song T, He J, Yen HL, Peiris M, Wu J. SARS-CoV-2 Viral Load in Upper Respiratory Specimens of Infected Patients. N Engl J Med. 2020 Mar 19;382(12):1177-1179. doi: 10.1056/NEJMc2001737. Epub 2020 Feb 19. PMID: 32074444; PMCID: PMC7121626.
19. To KK, Tsang OT, Leung WS, Tam AR, Wu TC, Lung DC, Yip CC, Cai JP, Chan JM, Chik TS, Lau DP, Choi CY, Chen LL, Chan WM, Chan KH, Ip JD, Ng AC, Poon RW, Luo CT, Cheng VC, Chan JF, Hung IF, Chen Z, Chen H, Yuen KY. Temporal profiles of viral load in posterior oropharyngeal saliva samples and serum antibody responses during infection by SARS-CoV-2: an observational cohort study. Lancet Infect Dis. 2020 May;20(5):565-574. doi: 10.1016/S1473-3099(20)30196-1. Epub 2020 Mar 23. PMID: 32213337; PMCID: PMC7158907.
20. Wölfel R, Corman VM, Guggemos W, Seilmaier M, Zange S, Müller MA, Niemeyer D, Jones TC, Vollmar P, Rothe C, Hoelscher M, Bleicker T, Brünink S, Schneider J, Ehmann R, Zwirglmaier K, Drosten C, Wendtner C. Virological assessment of hospitalized patients with COVID-2019. Nature. 2020 May;581(7809):465-469. doi: 10.1038/s41586-020-2196-x. Epub 2020 Apr 1. Erratum in: Nature. 2020 Dec 11;: PMID: 32235945.
21. He X, Lau EHY, Wu P, Deng X, Wang J, Hao X, Lau YC, Wong JY, Guan Y, Tan X, Mo X, Chen Y, Liao B, Chen W, Hu F, Zhang Q, Zhong M, Wu Y, Zhao L, Zhang F, Cowling BJ, Li F, Leung GM. Temporal dynamics in viral shedding and transmissibility of COVID-19. Nat Med. 2020 May;26(5):672-675. doi: 10.1038/s41591-020-0869-5. Epub 2020 Apr 15. Erratum in: Nat Med. 2020 Sep;26(9):1491-1493. PMID: 32296168.
22. Pan X, Chen D, Xia Y, Wu X, Li T, Ou X, Zhou L, Liu J. Asymptomatic cases in a family cluster with SARS-CoV-2 infection. Lancet Infect Dis. 2020 Apr;20(4):410-411. doi: 10.1016/S1473-3099(20)30114-6. Epub 2020 Feb 19. PMID: 32087116; PMCID: PMC7158985.
23. Kimball A, Hatfield KM, Arons M, James A, Taylor J, Spicer K, Bardossy AC, Oakley LP, Tanwar S, Chisty Z, Bell JM, Methner M, Harney J, Jacobs JR, Carlson CM, McLaughlin HP, Stone N, Clark S, Brostrom-Smith C, Page LC, Kay M, Lewis J, Russell D, Hiatt B, Gant J, Duchin JS, Clark TA, Honein MA, Reddy SC, Jernigan JA; Public Health – Seattle & King County; CDC COVID-19 Investigation Team. Asymptomatic and Presymptomatic SARS-CoV-2 Infections in Residents of a Long-Term Care Skilled Nursing Facility – King County, Washington, March 2020. MMWR Morb Mortal Wkly Rep. 2020 Apr 3;69(13):377-381. doi: 10.15585/mmwr.mm6913e1. PMID: 32240128; PMCID: PMC7119514.
24. Michael R Tom, Michael J Mina, To Interpret the SARS-CoV-2 Test, Consider the Cycle Threshold Value, Clinical Infectious Diseases, Volume 71, Issue 16, 15 October 2020, Pages 2252–2254, https://doi.org/10.1093/cid/ciaa619.
25. Young BE, Ong SWX, Kalimuddin S, et al. Epidemiologic Features and Clinical Course of Patients Infected With SARS-CoV-2 in Singapore. JAMA. 2020;323(15):1488–1494. doi:10.1001/jama.2020.3204.
26. Young, Barnaby E. and Ong, Sean Wei Xiang and Ng, Lisa FP and Anderson, Danielle E. and Chia, Wan Ni and Chia, Po Ying and Ang, Li Wei and Mak, Tze-Minn and Kalimuddin, Shirin and Chai, Louis Yi Ann and Pada, Surinder and Tan, Seow Yen and Sun, Louisa and Parthasarathy, Purmina and Fong, Siew-Wai and Chan, Yi-Hao and Tan, Chee Wah and Lee, Bernett and Rötzschke, Olaf and Ding, Ying and Tambyah, Paul and Low, Jenny GH and Cui, Lin and Barkham, Timothy and Lin, Raymond Tzer Pin and Leo, Yee-Sin and Renia, Laurent and Wang, Lin-Fa and Lye, David Chien and Team, Singapore 2019 Novel Coronavirus Outbreak Research, Immunological and Viral Correlates of COVID-19 Disease Severity: A Prospective Cohort Study of the First 100 Patients in Singapore (4/15/2020). Available at SSRN: https://ssrn.com/abstract=3576846 or http://dx.doi.org/10.2139/ssrn.3576846
27. Centers for Disease Control and Prevention: symptom-based strategy to discontinue isolation for persons with COVID-19 (Updated July 22, 2020). url: https://www.cdc.gov/coronavirus/2019-ncov/community/strategy-discontinue-isolation.html (Accessed on December 13th 2020).
28. La Scola B, Le Bideau M, Andreani J, Hoang VT, Grimaldier C, Colson P, Gautret P, Raoult D. Viral RNA load as determined by cell culture as a management tool for discharge of SARS-CoV-2 patients from infectious disease wards. Eur J Clin Microbiol Infect Dis. 2020 Jun;39(6):1059-1061. doi: 10.1007/s10096-020-03913-9. Epub 2020 Apr 27. PMID: 32342252; PMCID: PMC7185831.
29. Singanayagam A, Patel M, Charlett A, Lopez Bernal J, Saliba V, Ellis J, Ladhani S, Zambon M, Gopal R. Duration of infectiousness and correlation with RT-PCR cycle threshold values in cases of COVID-19, England, January to May 2020. Euro Surveill. 2020;25(32):2001483. doi: 10.2807/1560-7917.ES.2020.25.32.2001483. PMID: 32794447; PMCID: PMC7427302.
30. Covid test should track viral load too, says new ICMR study. url: https://www.msn.com/en-in/news/in-depth/covid-test-should-track-viral-load-too-says-new-icmr-study/ar-BB14WprR (Accessed on December 14th 2020).
31. Real time PCR Ct values. url: https://www.wvdl.wisc.edu/wp-content/uploads/2013/01/WVDL.Info_.PCR_Ct_Values1.pdf
32. CT value in Covid-19 test: what is it and why is it being discussed? url: https://en.as.com/en/2020/09/11/latest_news/1599829754_673322.html (Accessed on December 14th 2020).
33. Covid-19 test reports must also state cycle threshold value. url: https://timesofindia.indiatimes.com/city/bengaluru/covid-19-test-reports-must-also-state-ct-value-doctors/articleshow/77956302.cms (Accessed on December 14th 2020).
34. Korean centers for Disease Control & prevention. Findings from investigation and analysis of repositive cases. url: https://is.cdc.go.kr/upload_comm/syview/doc.html?fn=158993708884700.pdf&rs=/upload_comm/docu/0030/ (Accessed on December 14th 2020).
35. Chen F, Fu D, Yang Q, Geng Z, Xia J, Wang Z, Wang L. Low transmission risk of 9 asymptomatic carriers tested positive for both SARS-CoV-2 nucleic acid and serum IgG. Journal of Infection. 2020. url: https://www.journalofinfection.com/article/S0163-4453(20)30416-3/fulltext (Accessed on December 14th 2020).
36. Sciensano. Interpretation of PCR results and infectivity RAG 30/06/2020. url: https://covid-19.sciensano.be/sites/default/files/Covid19/30300630_Advice_RAG_interpretation%20PCR.pdf (Accessed on December 14th 2020).
37. The trouble with PCR tests. Switzerland. url: https://swprs.org/the-trouble-with-pcr-tests/ (Accessed on December 15th 2020).
38. Mina, Michael, Steve Miller, Michael Quigley, Tyler Prentiss, John E. McKinnon, and Stewart Comer. Analyzing Conflicting Results in Rapid Point-of-Care COVID-19 Testing (2020). url: https://dash.harvard.edu/handle/1/37364504 (Accessed on December 15th 2020).
39. Your Coronavirus Test Is Positive. Maybe It Shouldn’t Be. url: https://www.nytimes.com/2020/08/29/health/coronavirus-testing.html (Accessed on December 15th 2020).
40. Dillner et al. Screening for high amounts of SARS-CoV-2 identifies pre-symptomatic subjects among healthy healthcare workers. url: https://www.medrxiv.org/content/10.1101/2020.12.13.20248122v1.full.pdf (Accessed on December 17th 2020).
41. CEBM. University of Oxford. COVID-19 evidence. url: https://www.cebm.net/covid-19/infectious-positive-pcr-test-result-covid-19/ (Accessed on December 15th 2020).
42. Pandemic News. Scientists show COVID tests are ‘useless’, are based on ‘flawed science’. url: https://pandemic.news/2020-12-11-scientists-show-covid-tests-are-useless.html# (Accessed on December 15th 2020).


